
FM-B2QN33
Creator
Fri, May 29, 2026, 11:07 PM
2d ago
Suleja, Nigeria
9.16500, 7.20400
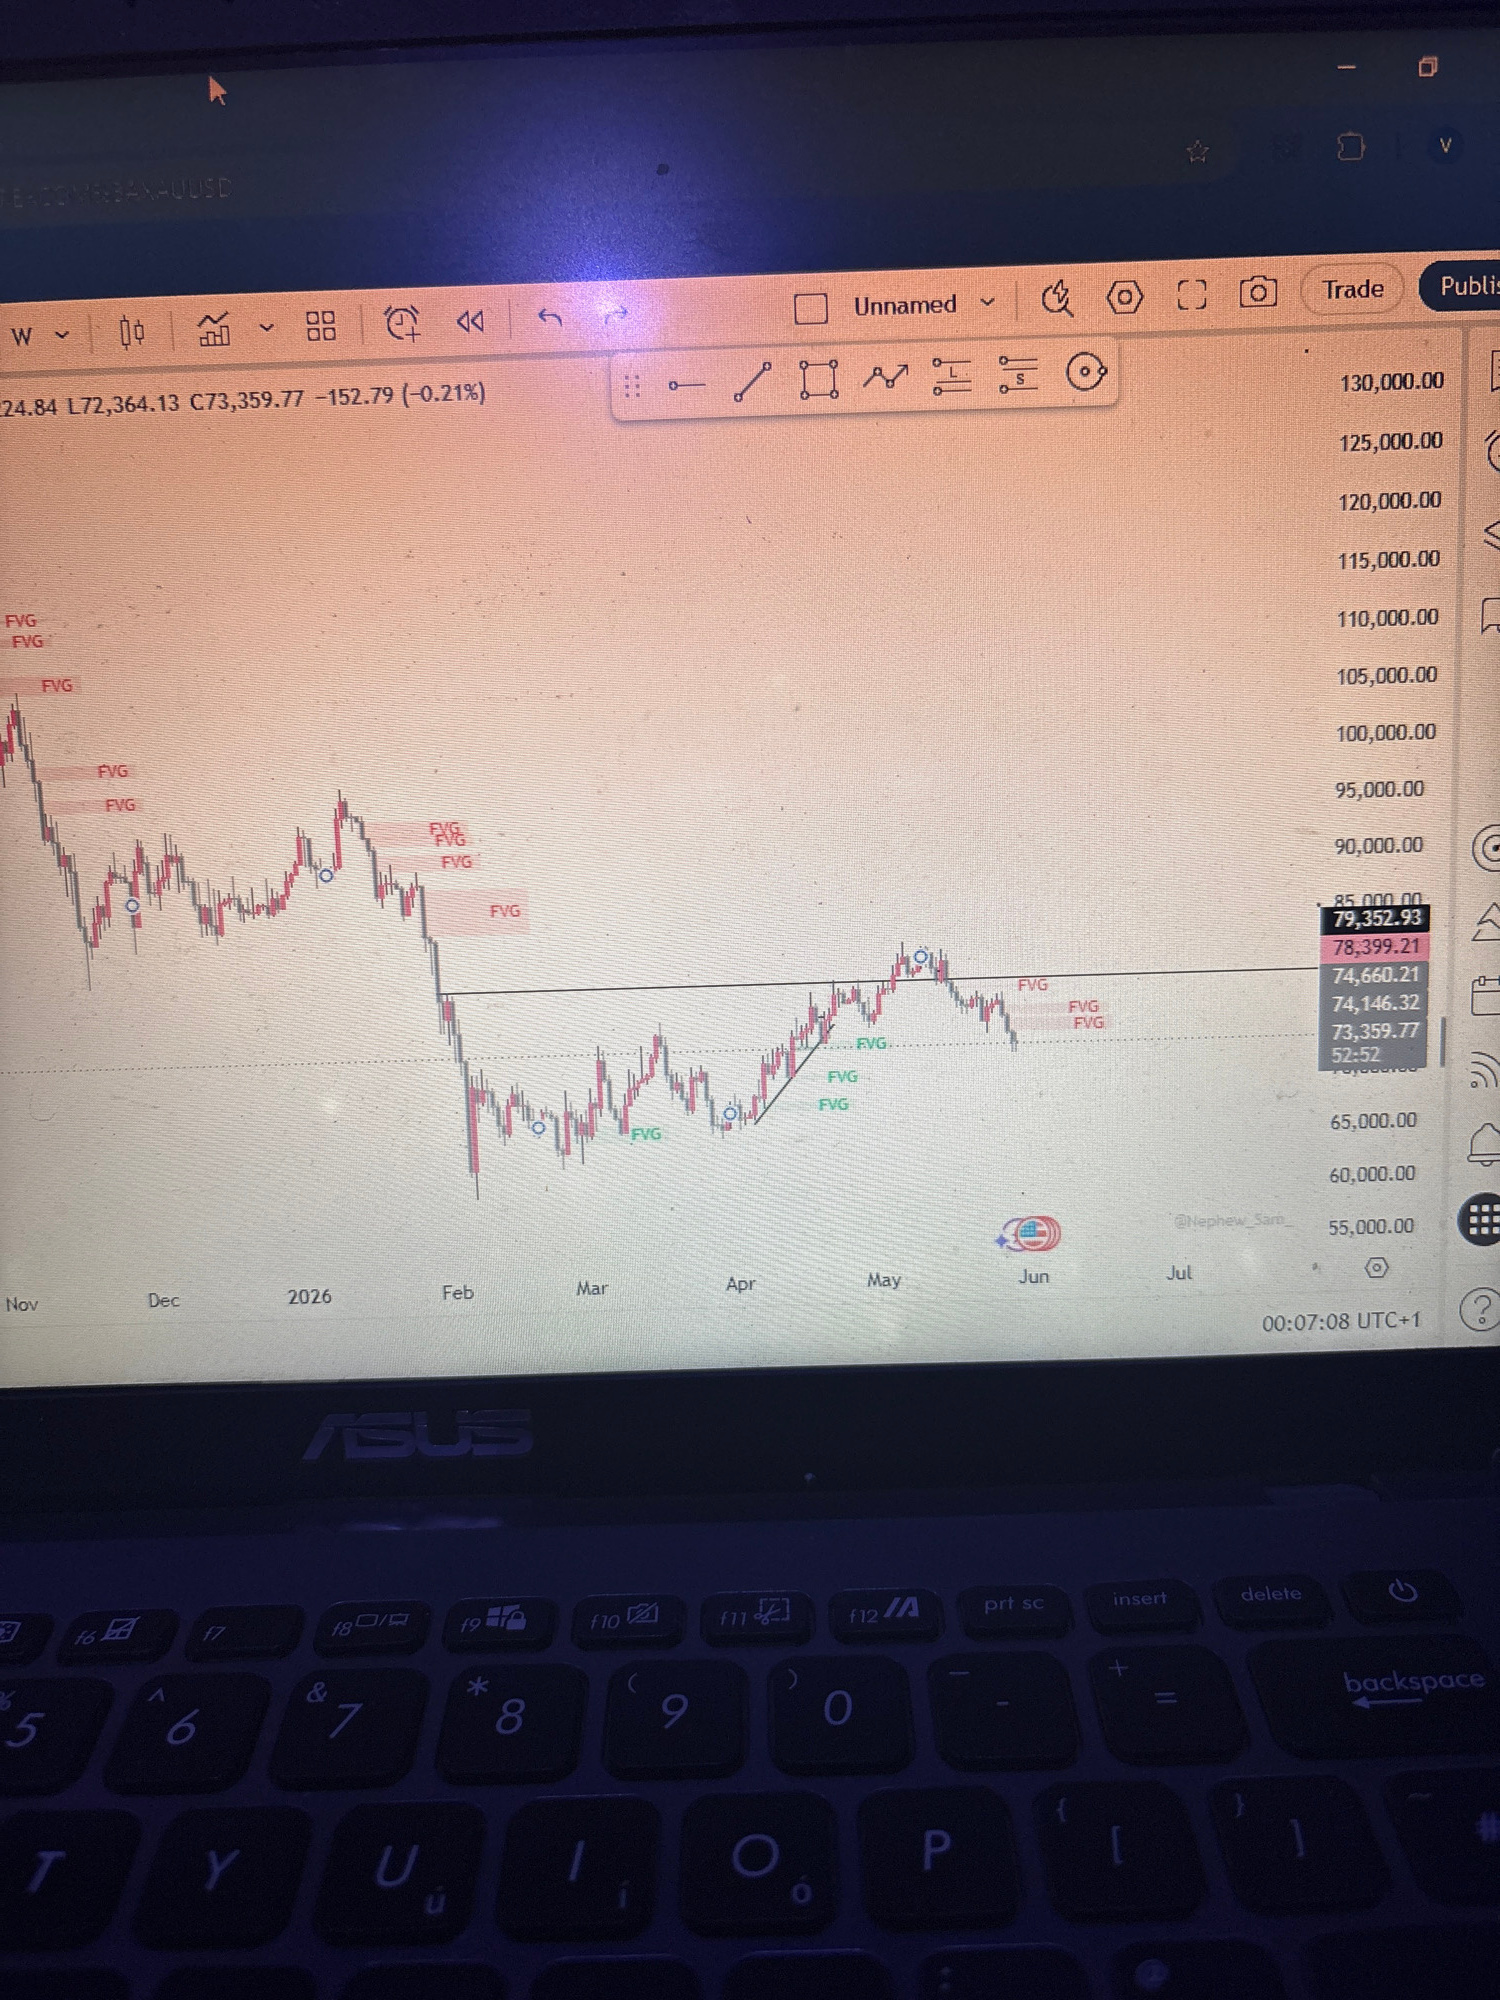
The image shows a computer screen displaying a financial chart. The chart is a candlestick chart, with red and green candles indicating price movements over time. The x-axis represents time, labeled w…read more
anxious
focused
intense
hopeful
determined
Technical
ID
2c58adbd-4f47-4b9b-9
Usage Rights
This media is free for non-commercial use with proper attribution.
Commercial use, AI/ML training, and derivative works are prohibited without explicit consent from the creator.
Licensed under CC BY-NC 4.0 with additional AI/ML restrictions. Full terms →