Stake attention in this memory
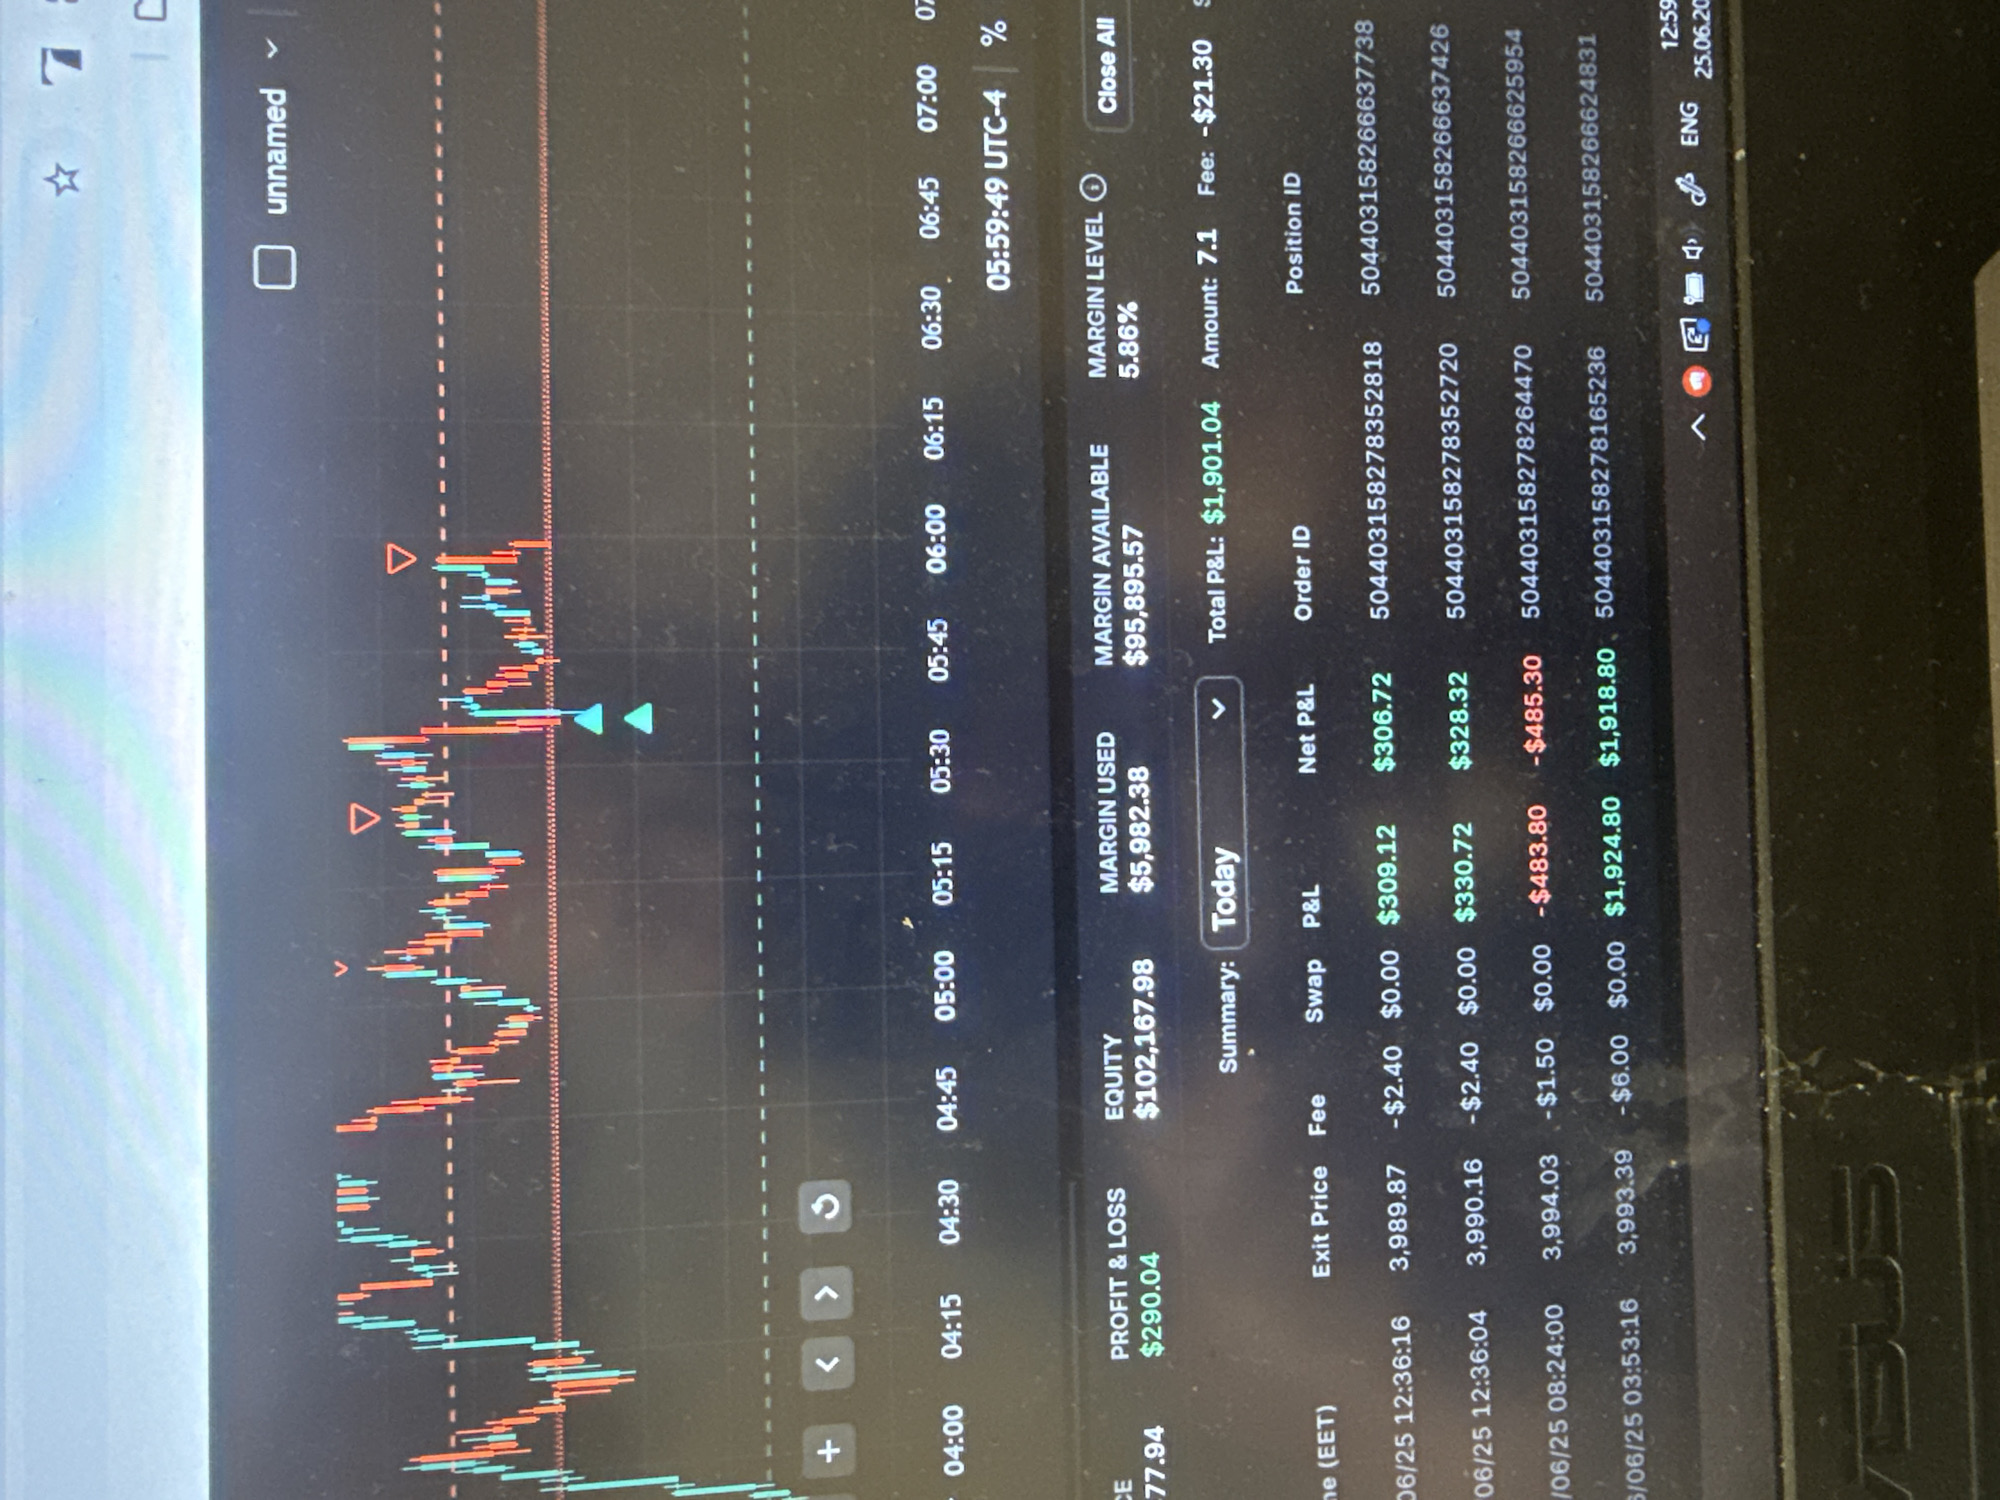
This is a photograph of a digital trading platform's interface, displayed on a screen, likely a laptop or tablet. The screen is angled, suggesting it's being viewed from a side or from above. The platform shows a candlestick chart with orange and blue bars representing price movements over time, with vertical dashed lines indicating time intervals. Prominently displayed are various data points related to trading activity. These include financial figures such as "PROFIT & LOSS," "EQUITY," "MARGIN USED," and "MARGIN AVAILABLE," along with percentages indicating "MARGIN LEVEL." A section labeled "Summary: Today" shows a "Total P&L" of $1,901.04. Below the summary, a table lists specific trading events with details like "Exit Price," "Fee," "Swap," "P&L," "Net P&L," "Order ID," and "Position ID." The dates and times indicate trading activity occurring on June 25th, with times ranging from early morning (03:53:16) to later in the day (12:36:16). The time zone appears to be EET (Eastern European Time), and the date "25.06.20" is visible at the bottom right. There are navigational elements at the top left of the screen, including arrows and a refresh icon, and a tab labeled "unnamed." The overall impression is one of active financial trading, with the user monitoring their positions and financial performance. The setting appears to be indoors, given the artificial light reflecting on the screen and the presence of what looks like a laptop's keyboard edge at the bottom. No people are visible in the frame.
No transactions found