Stake attention in this memory
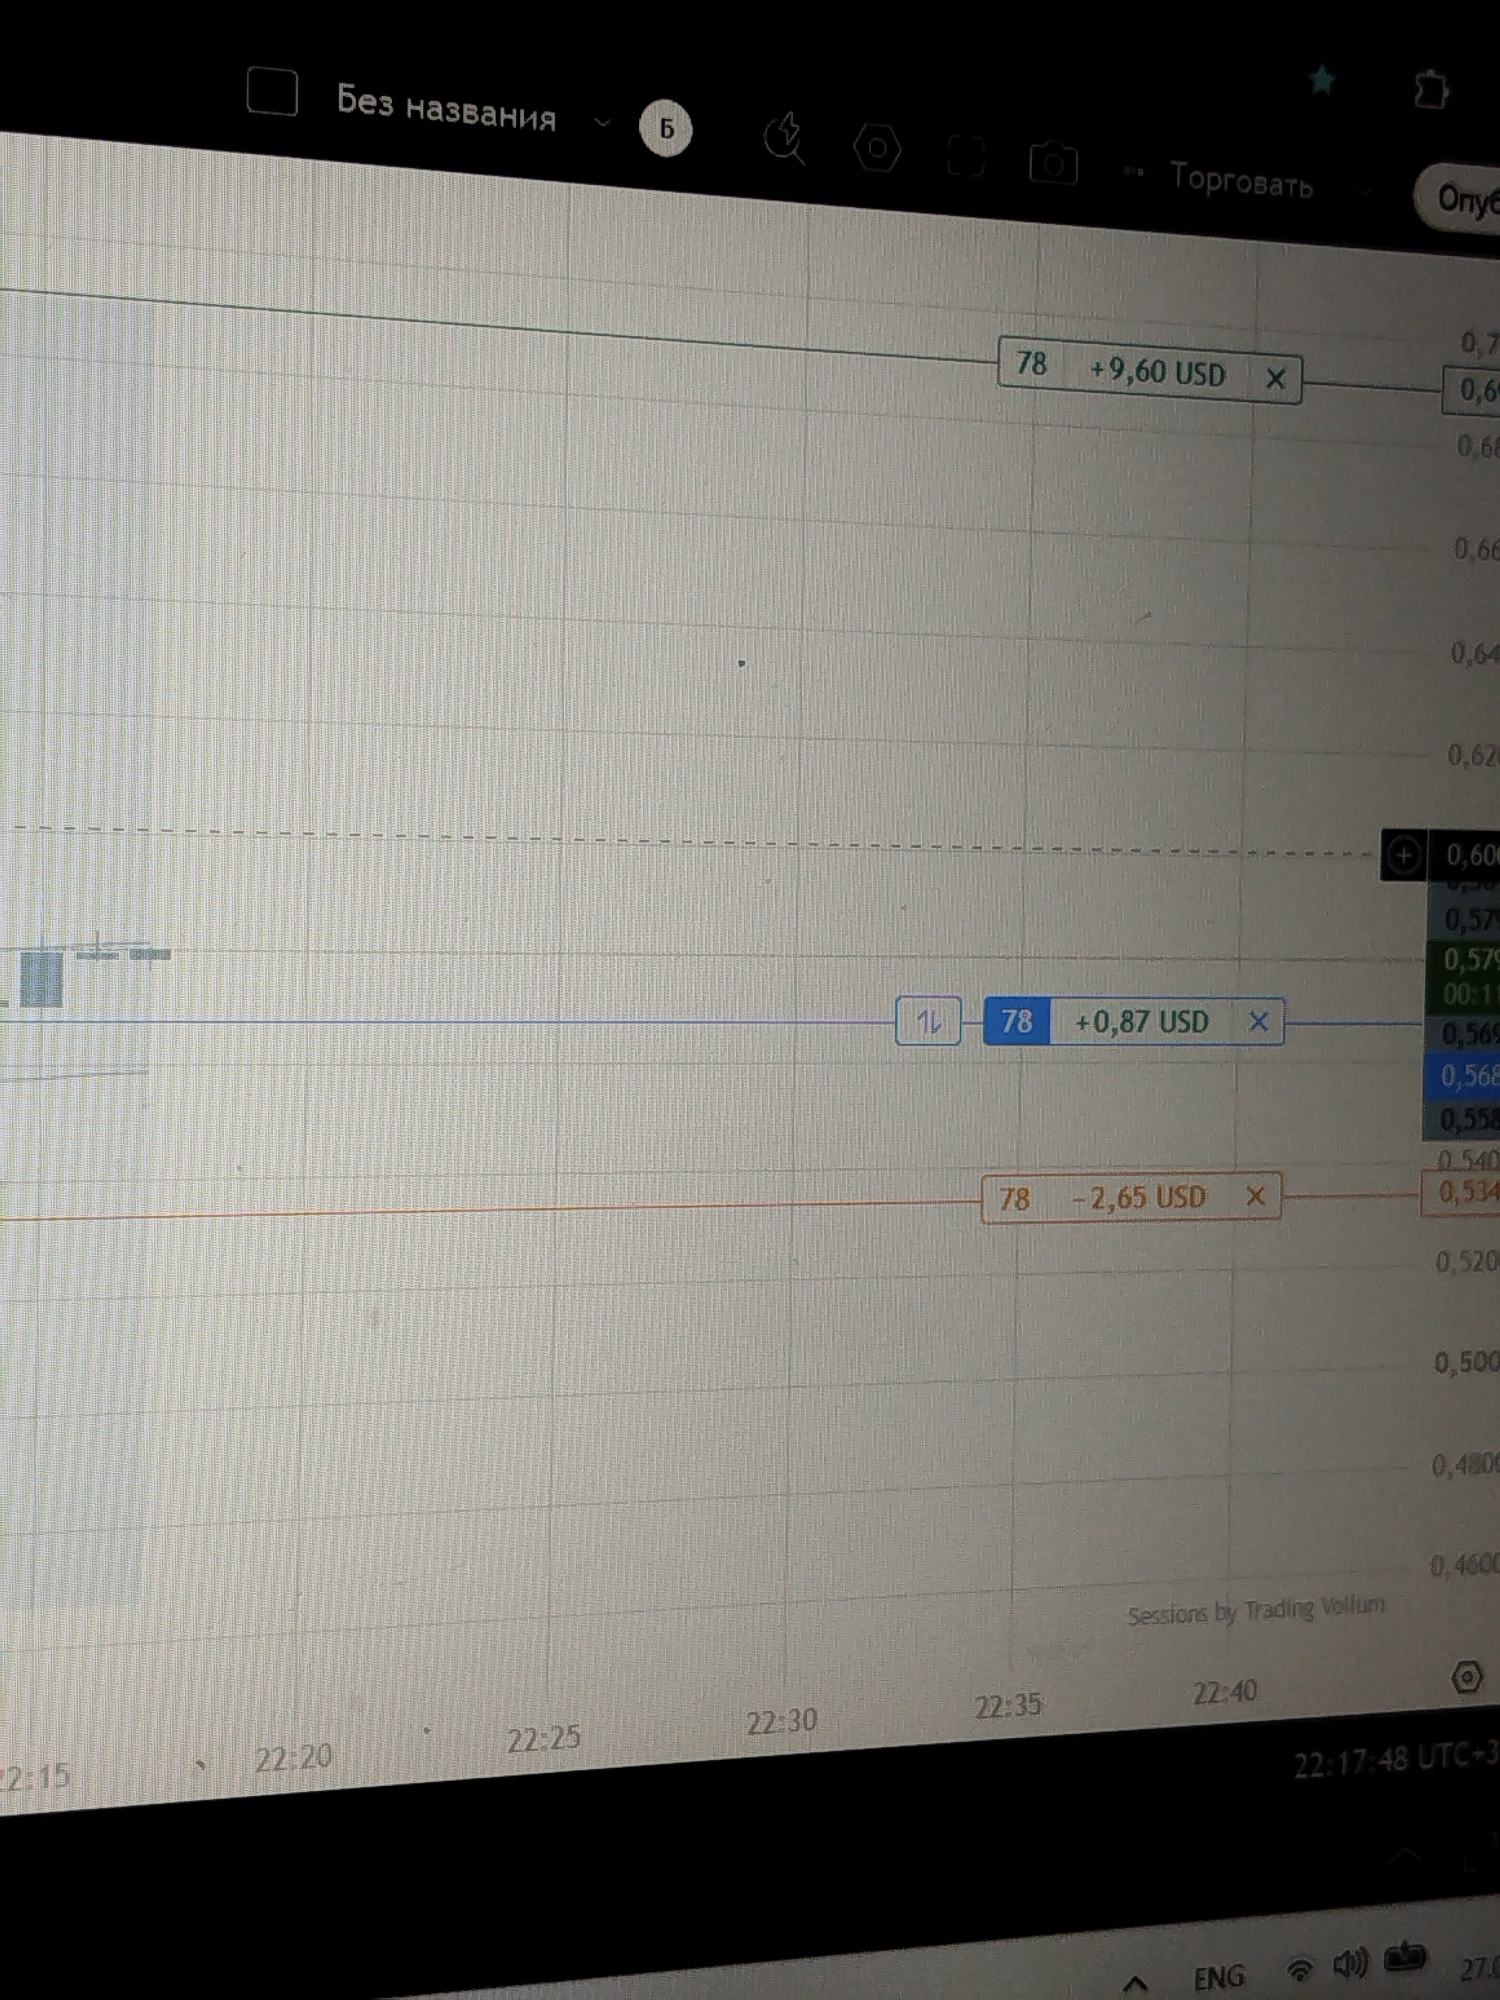
The image displays a close-up of a computer screen showing a financial trading chart. The chart features horizontal and vertical grid lines, with several colored lines representing price movements. There are also numerical labels on both the vertical (price) and horizontal (time) axes. Various text elements and graphical indicators are visible on the screen, including buttons with numbers and currency amounts like "+9,60 USD", "+0,87 USD", and "-2,65 USD". Some of these indicators appear to be part of a trading platform interface. The overall impression is that of financial market data being monitored or analyzed on a digital display. No specific city or location can be identified from the image.
No transactions found