Stake attention in this memory
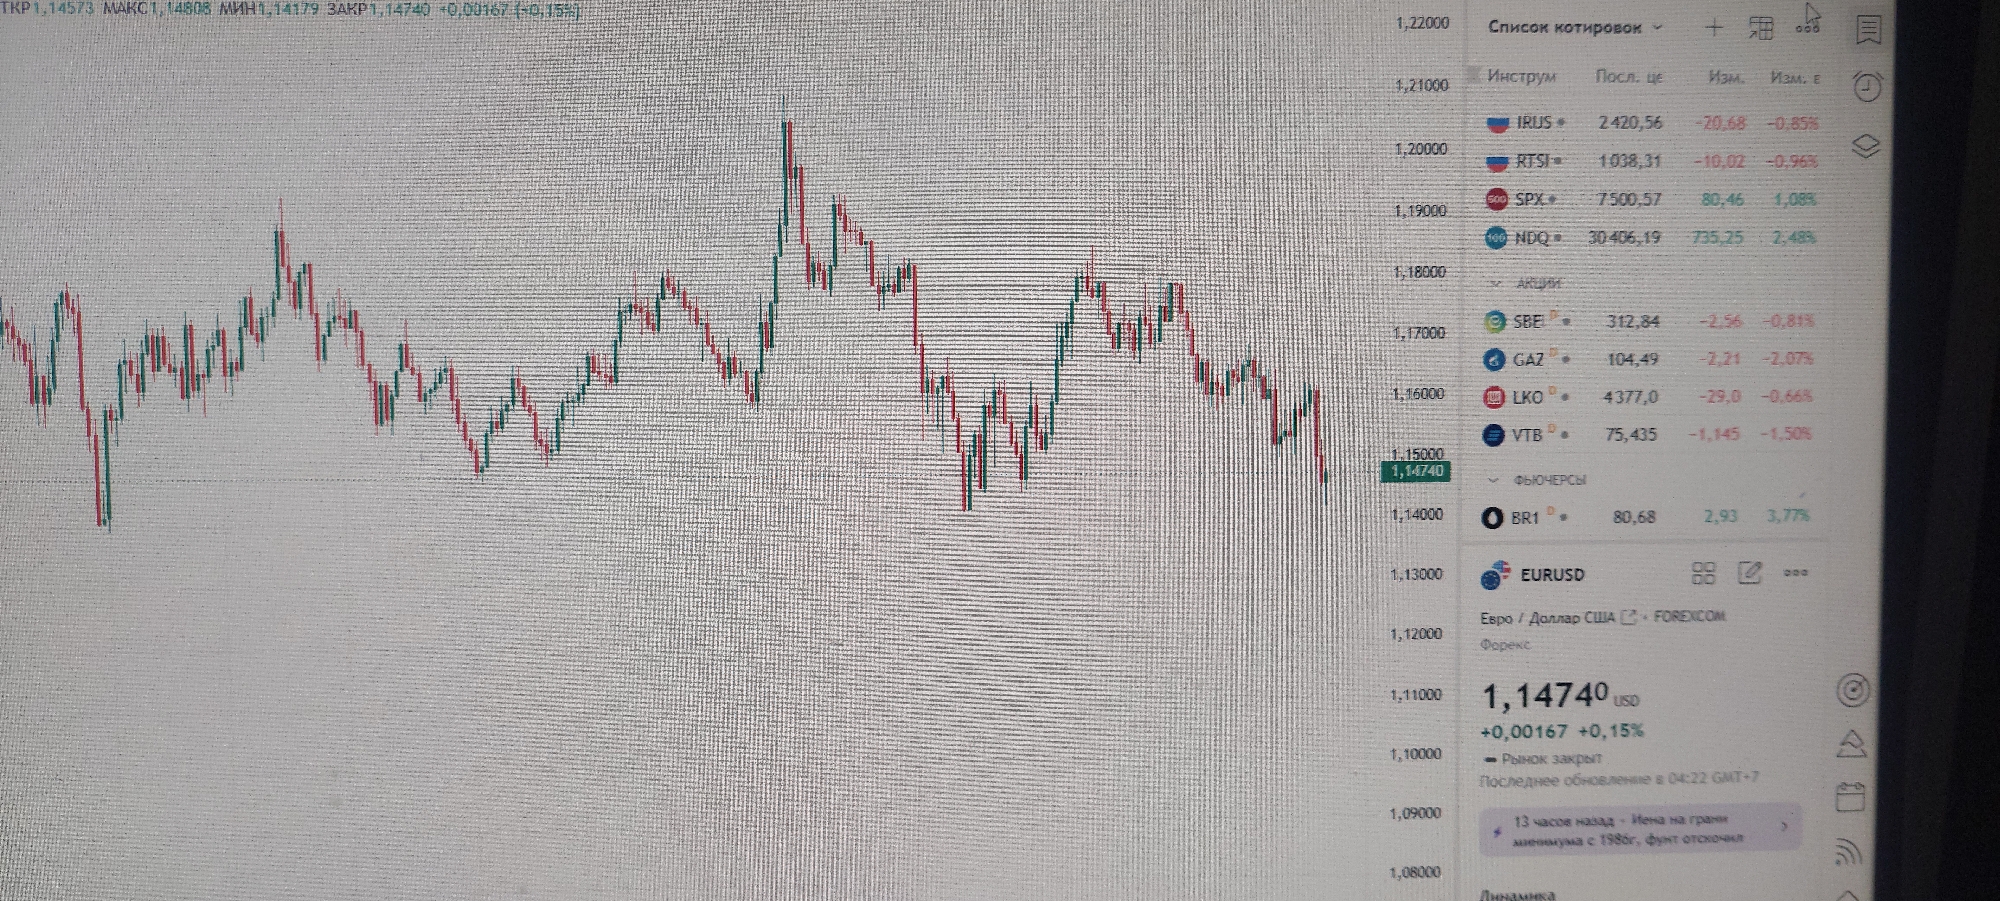
The image displays a computer screen showing a financial trading platform. On the left side of the screen, a candlestick chart illustrates the price movement of a financial instrument over time, with green candles indicating upward price movement and red candles indicating downward movement. The y-axis of the chart shows price levels ranging from 1.08000 to 1.22000. To the right of the chart, a list of financial instruments is displayed. Each instrument has a name, a current price, and a percentage change. Some of the listed instruments include "IRUS," "RTSI," "SPX," "NDQ," "SBER," "GAZ," "LKO," "VTB," "BR1," and "EURUSD." The "EURUSD" entry is highlighted and shows a current price of 1.14740 USD, with a gain of +0.00167 and a 0.15% change. Below this, it indicates "Рынок закрыт" (Market closed) and "Последнее обновление в 04:22 GMT+7" (Last update at 04:22 GMT+7). The background of the screen appears to be a textured or patterned surface, possibly a wall or a screen protector. There are no discernible elements in the image that indicate a specific location within the city of New York, United States of America. The image focuses solely on the digital display of financial data.
Symbol
4DBFF
Volume
10
Creator
+$0.00
Revenue
+$0.00
TVL
$0.00