Stake attention in this memory
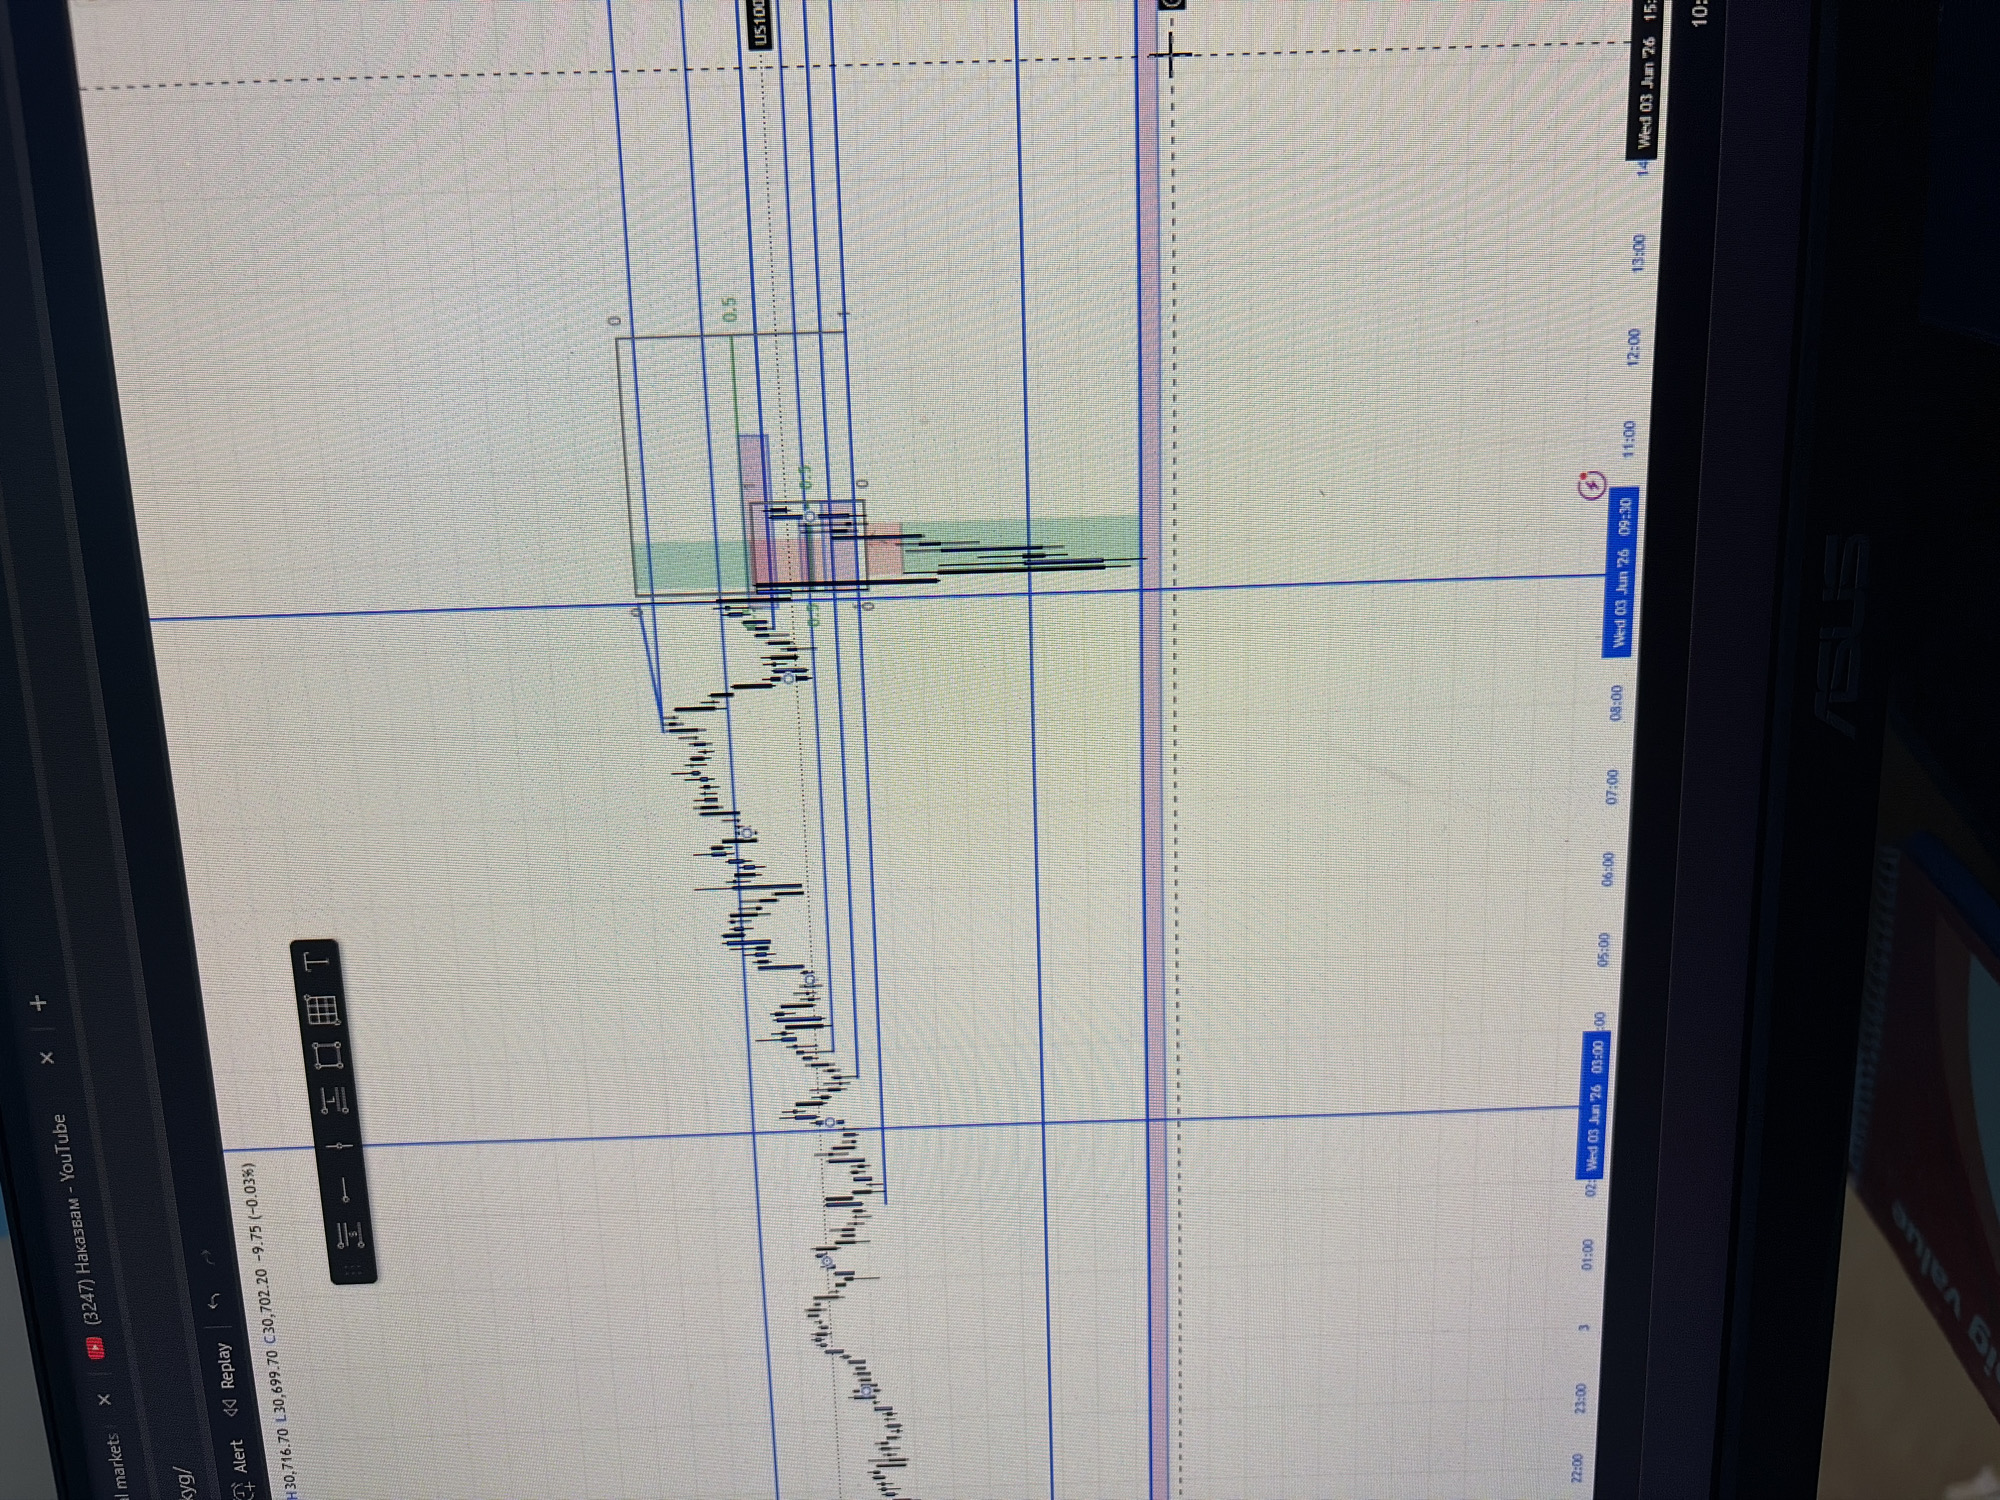
An angled view of a computer screen displays a financial trading chart, likely from a platform like TradingView. The screen is predominantly filled with a candlestick chart showing price action, marked with various horizontal and vertical lines, as well as shaded rectangular boxes (green and red). Time and date labels along the bottom indicate "Wed 03 Jun 26" at various times, including "03:00," "09:30," and "15:". The instrument being displayed is identified as "US100," likely the Nasdaq 100 index. Current price data is visible at the top left, showing "30,716.70" (High), "30,699.70" (Low), "30,702.20" (Close), and a change of "-9.75 (-0.03%)." A vertical toolbar with several drawing and analysis tools, including a text tool ('T') and line-drawing options, is positioned on the left side of the chart. Along the top edge of the browser interface, several tabs are open, including "al markets," "(3247) Наказвам - YouTube," and "kyg/." Buttons for "Alert" and "Replay" are also visible. In the background, to the right of the screen, part of a reddish object with the text "ig value" is partially visible. The overall scene suggests an individual engaged in financial market analysis or trading.
No transactions found