Stake attention in this memory
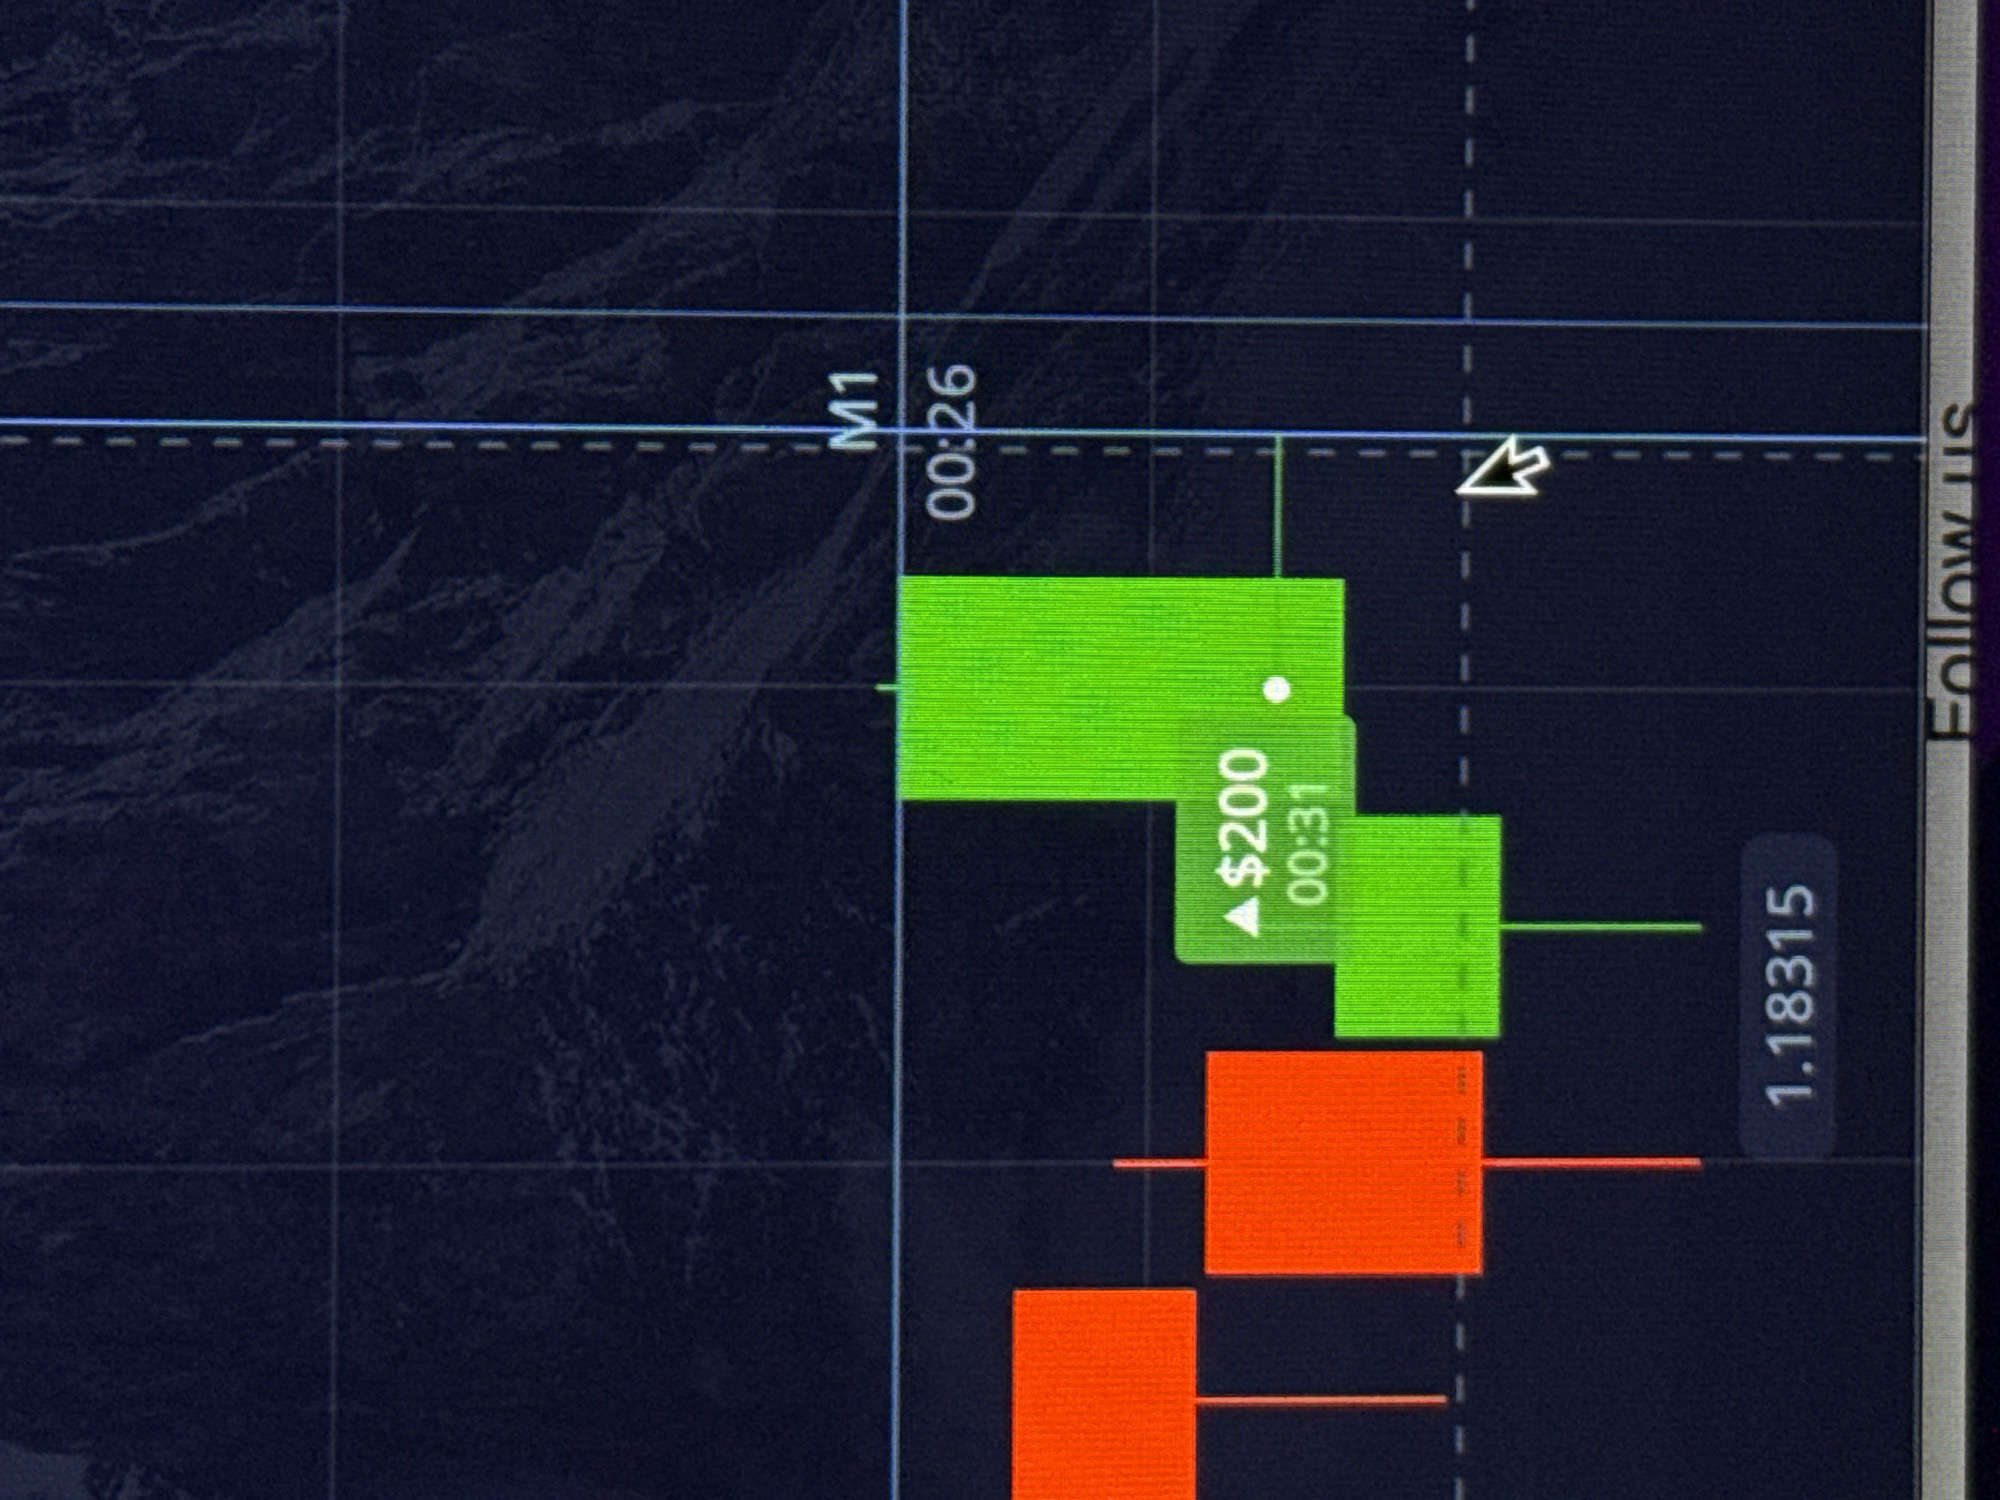
The image displays a digital screen showing a financial candlestick chart, likely from a trading platform, overlaid on a dark, textured background that resembles a blurry, mountainous landscape. The chart consists of green candlesticks, signifying upward price movement, and orange/red candlesticks, indicating downward movement. Horizontal and vertical grid lines, both solid and dashed, structure the chart. A white arrow-shaped cursor is visible on the right side, positioned near a dashed horizontal line. Several textual and numerical details are present: - "M1" is displayed at the top, suggesting a 1-minute chart timeframe. - A timestamp "00:26" appears beside "M1". - Within a prominent green candlestick, the text "▲ $200" is shown, indicating a profit of $200. - Below this profit indicator, another timestamp "00:31" is visible. - On the right vertical axis, a price level "1.18315" is displayed. - Partially visible along the far right edge is the text "Follow Us", likely a social media prompt. The chart illustrates recent market activity, with a sequence of bearish (orange/red) candles preceding bullish (green) ones, with a specific profit highlighted. The scene is typical of a financial analysis or trading interface. No individuals are depicted, and there are no direct visual cues regarding time of day, weather, or emotions. The image content does not independently provide location context for Ayia Napa, Cyprus.
No transactions found