Stake attention in this memory
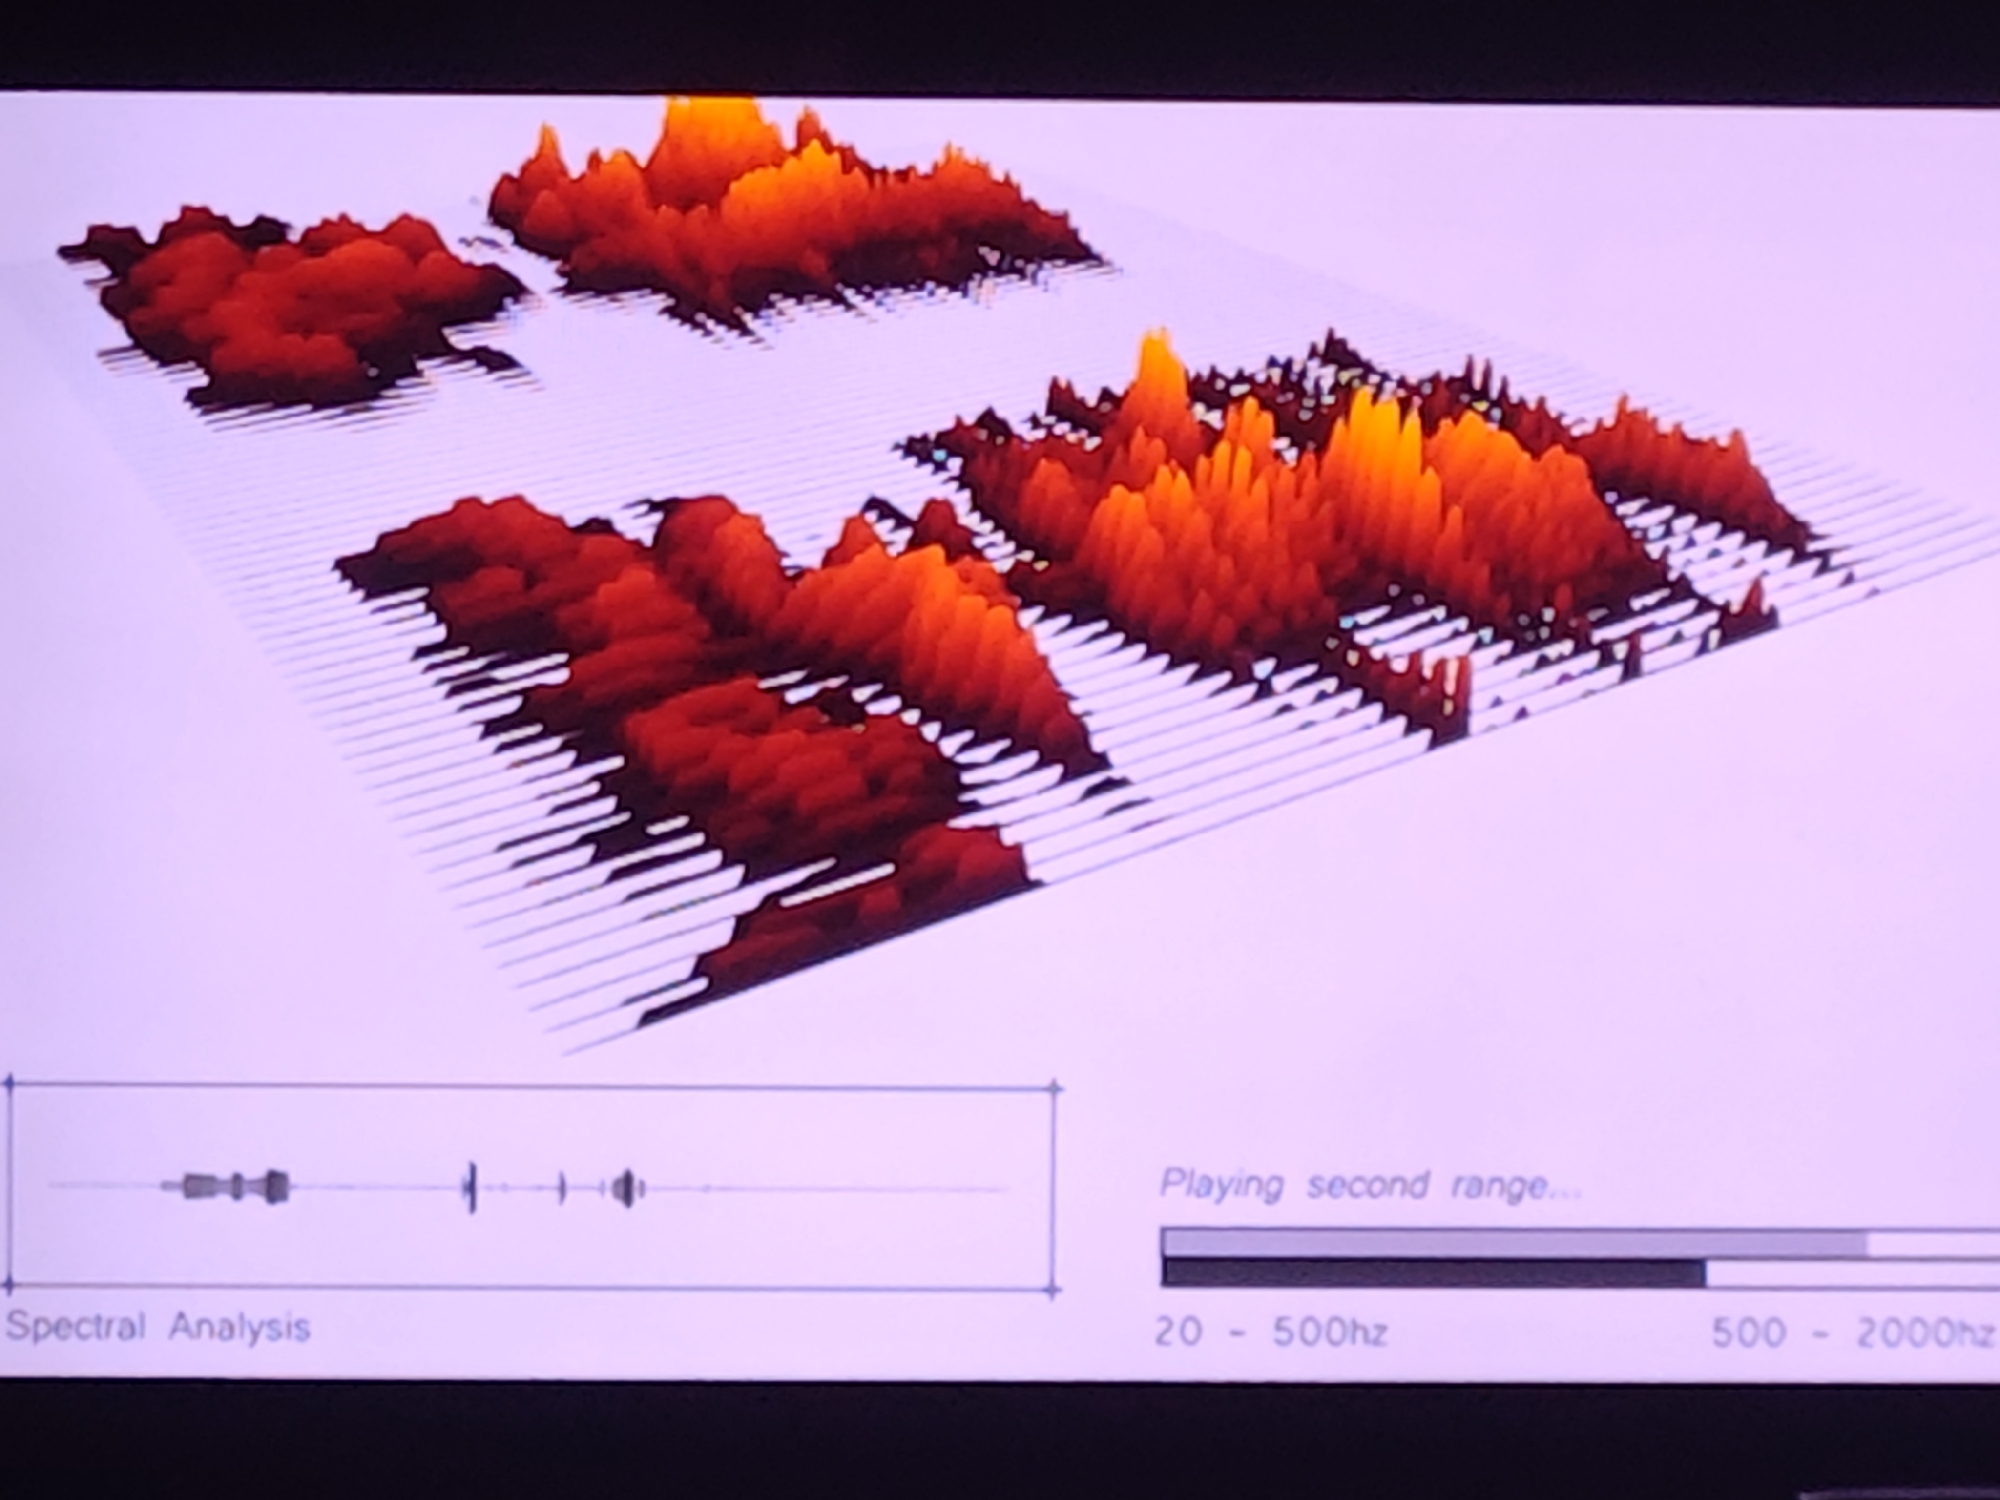
The image displays a 3D spectral analysis graph on a computer screen. The graph features multiple peaks rendered in shades of red, orange, and yellow, against a white background with faint horizontal lines. The peaks represent intensity at different frequencies over time, suggesting an analysis of audio or other signal data. In the lower left corner, there is a waveform or timeline labeled "Spectral Analysis." This shows a horizontal line with several vertical markers, indicating specific points or segments within the analyzed data. In the lower right corner, there is a legend or color bar with the text "Playing second range..." above it. Below this, a gradient bar transitions from dark gray to light gray, labeled with frequency ranges: "20 - 500hz" on the left and "500 - 2000hz" on the right. This indicates that the color intensity in the 3D graph corresponds to the amplitude or power of the signal within these frequency bands. The image appears to be a screenshot or photograph of a digital display, likely from a computer or specialized analysis equipment. There is no visible indication of a specific city or location beyond what is presented on the screen itself. The scene is a digital representation of data, not a physical environment.
No transactions found