Stake attention in this memory
Anxiety
Hope
Uncertainty
Excitement
Frustration
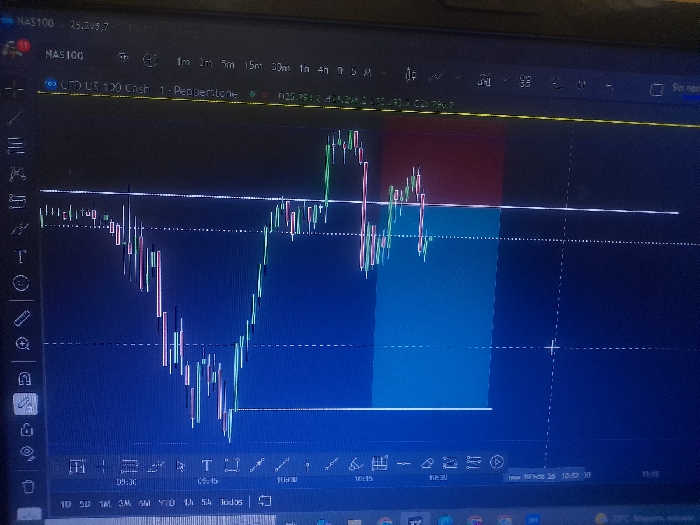
The image displays a trading chart for NAS100, specifically "CFD US 100 Cash - 1 - Pepperstone". The chart is set to a 1-minute to 4-hour timeframe. Candlesticks represent price movements. A short position is highlighted with a red area indicating the stop loss and a blue area indicating the potential profit. Horizontal white lines mark potential support and resistance levels. The timestamp indicates the date "19 Feb 26" and the time around 10:50.
transactions
revenues
stakers
Earliest
Latest
Highest stake
No transactions found