IMAGE

Zacki
Creator
Fri, Jun 19, 2026, 02:17 PM
5d ago
Belyye Berega, Russia
53.21300, 34.66700
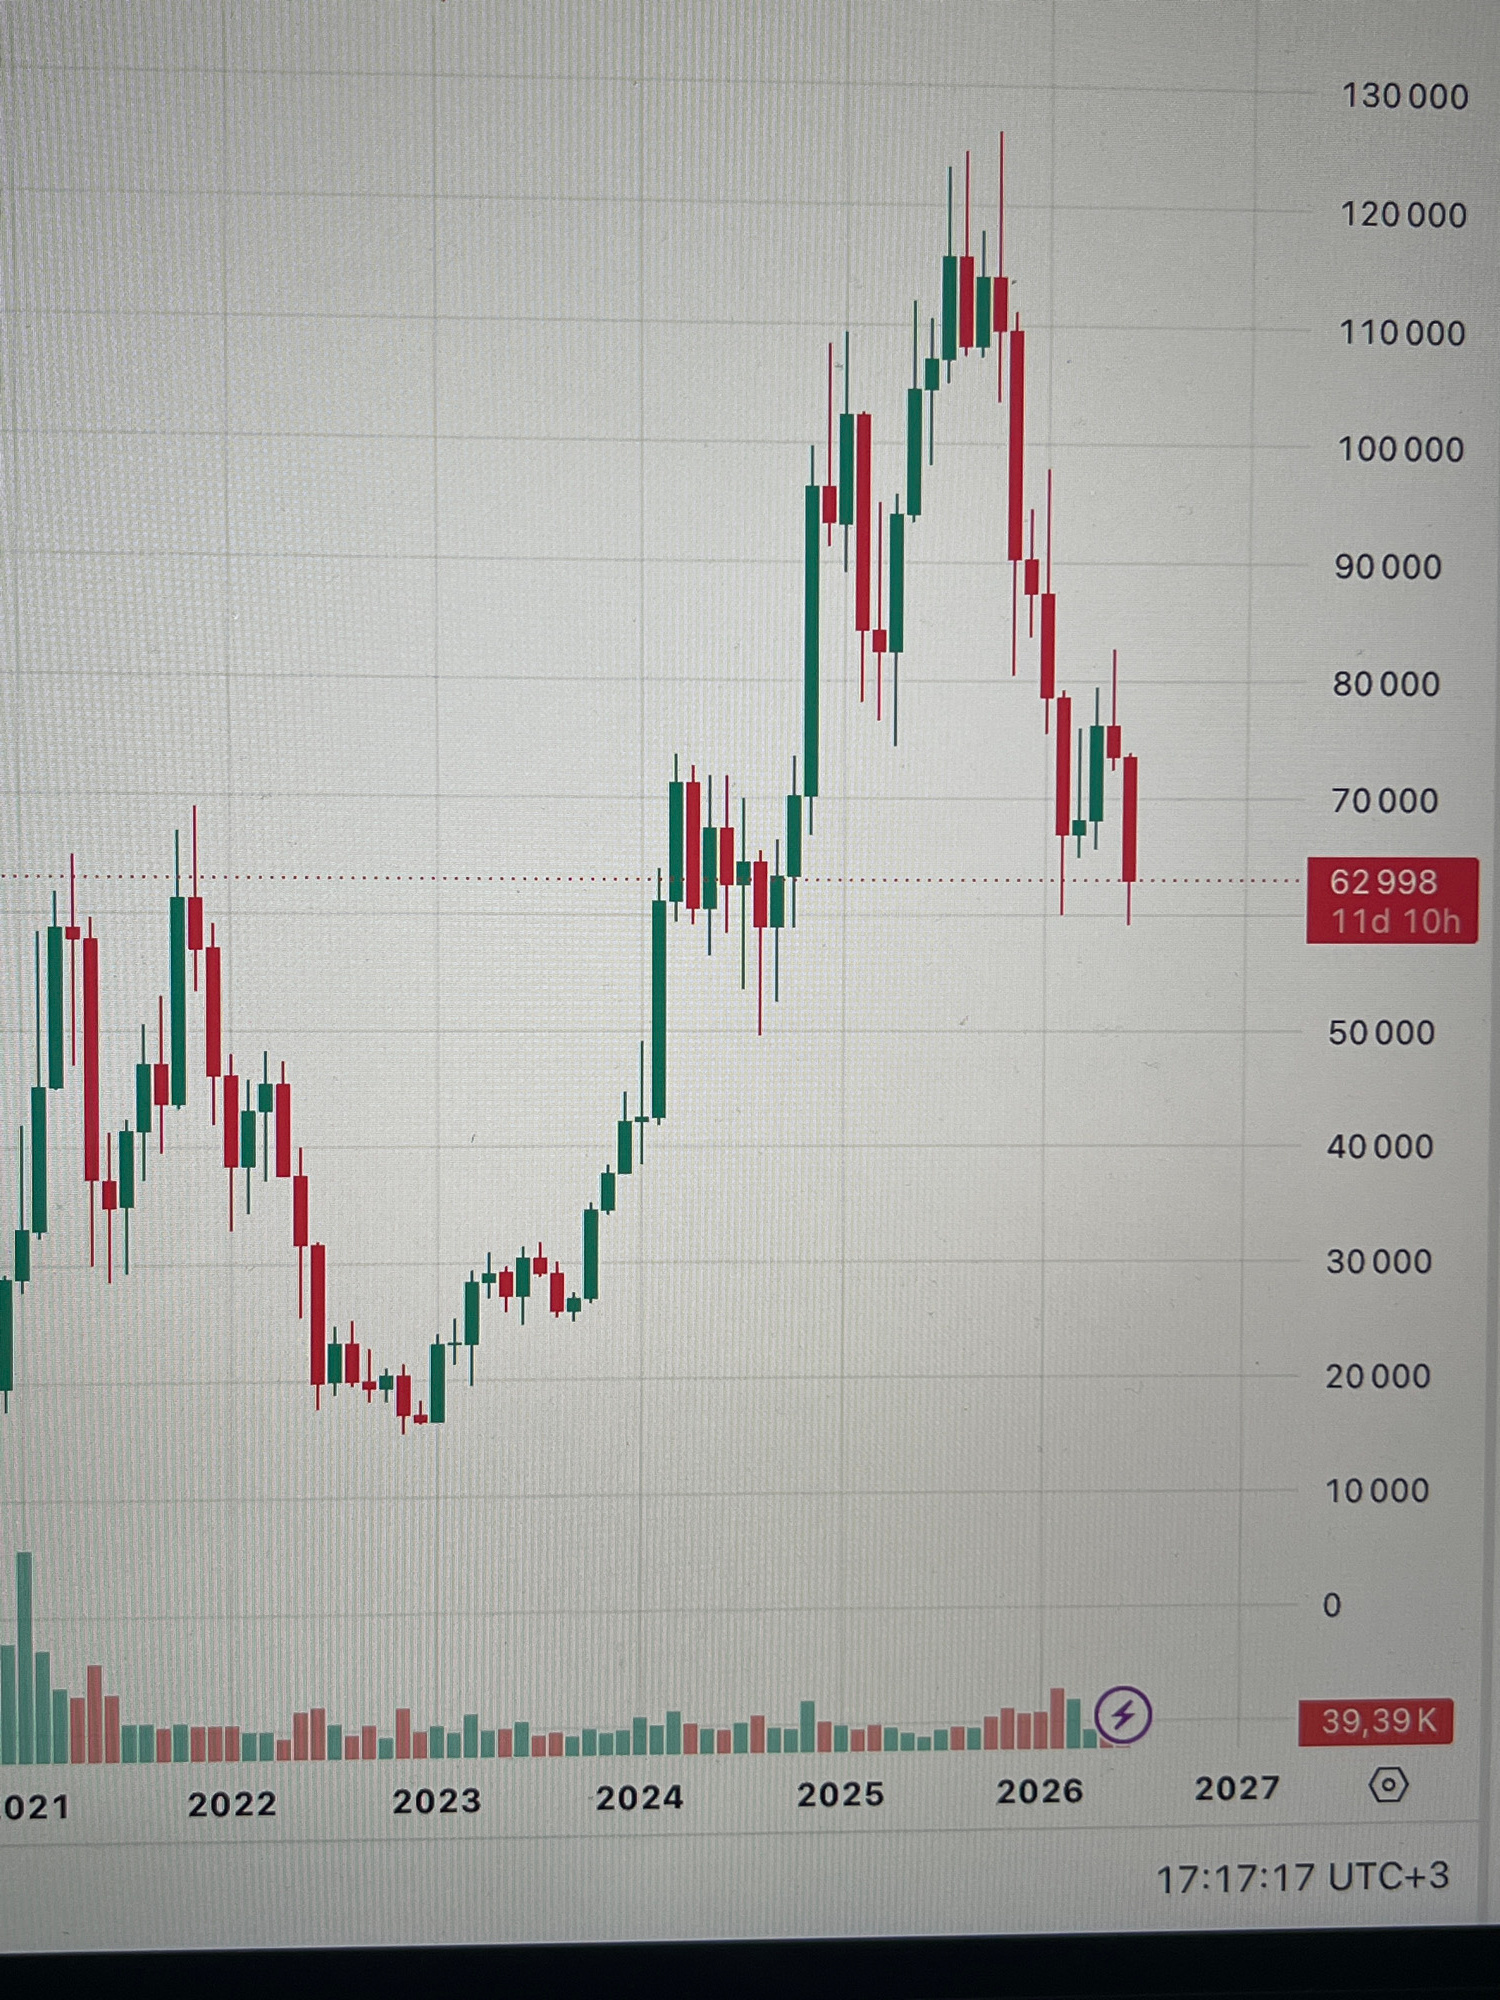
This is a screenshot of a financial trading chart, likely a candlestick chart, displayed on a digital screen. The chart shows price movements over time, with green candles indicating upward price move…read more
anxiety
hope
volatility
uncertainty
greed
Technical
ID
6d2d25a5-1dcc-4bcd-8
Usage Rights
This media is free for non-commercial use with proper attribution.
Commercial use, AI/ML training, and derivative works are prohibited without explicit consent from the creator.
Licensed under CC BY-NC 4.0 with additional AI/ML restrictions. Full terms →