IMAGE
CB
FM-GTsl12
Creator
Fri, Jun 19, 2026, 10:47 AM
5d ago
Ақсай қалалық әкімдігі, Kazakhstan
51.19100, 53.02400
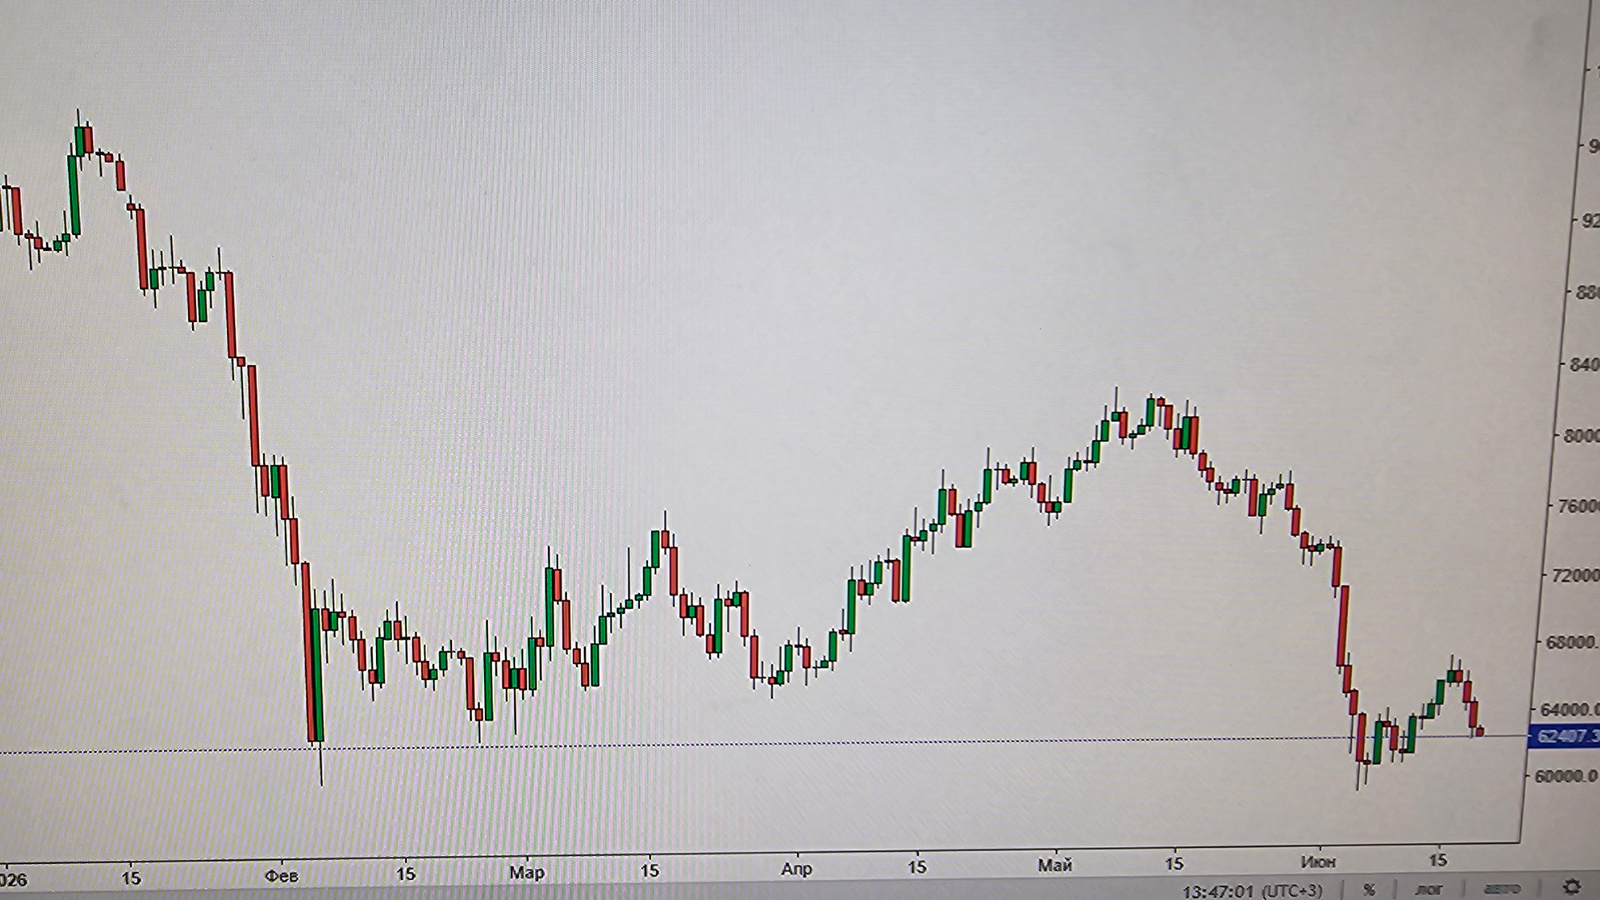
The image is a screenshot of a financial trading chart displayed on a computer screen. The chart shows candlestick patterns representing price movements over time, with red candles indicating a price…read more
anxiety
uncertainty
volatility
financial
bearish
Technical
ID
7a52dad0-ce9a-4356-8
Usage Rights
This media is free for non-commercial use with proper attribution.
Commercial use, AI/ML training, and derivative works are prohibited without explicit consent from the creator.
Licensed under CC BY-NC 4.0 with additional AI/ML restrictions. Full terms →