IMAGE
Dmitriy-NPC
Creator
Fri, Jun 19, 2026, 08:51 AM
5d ago
Unknown, Unknown
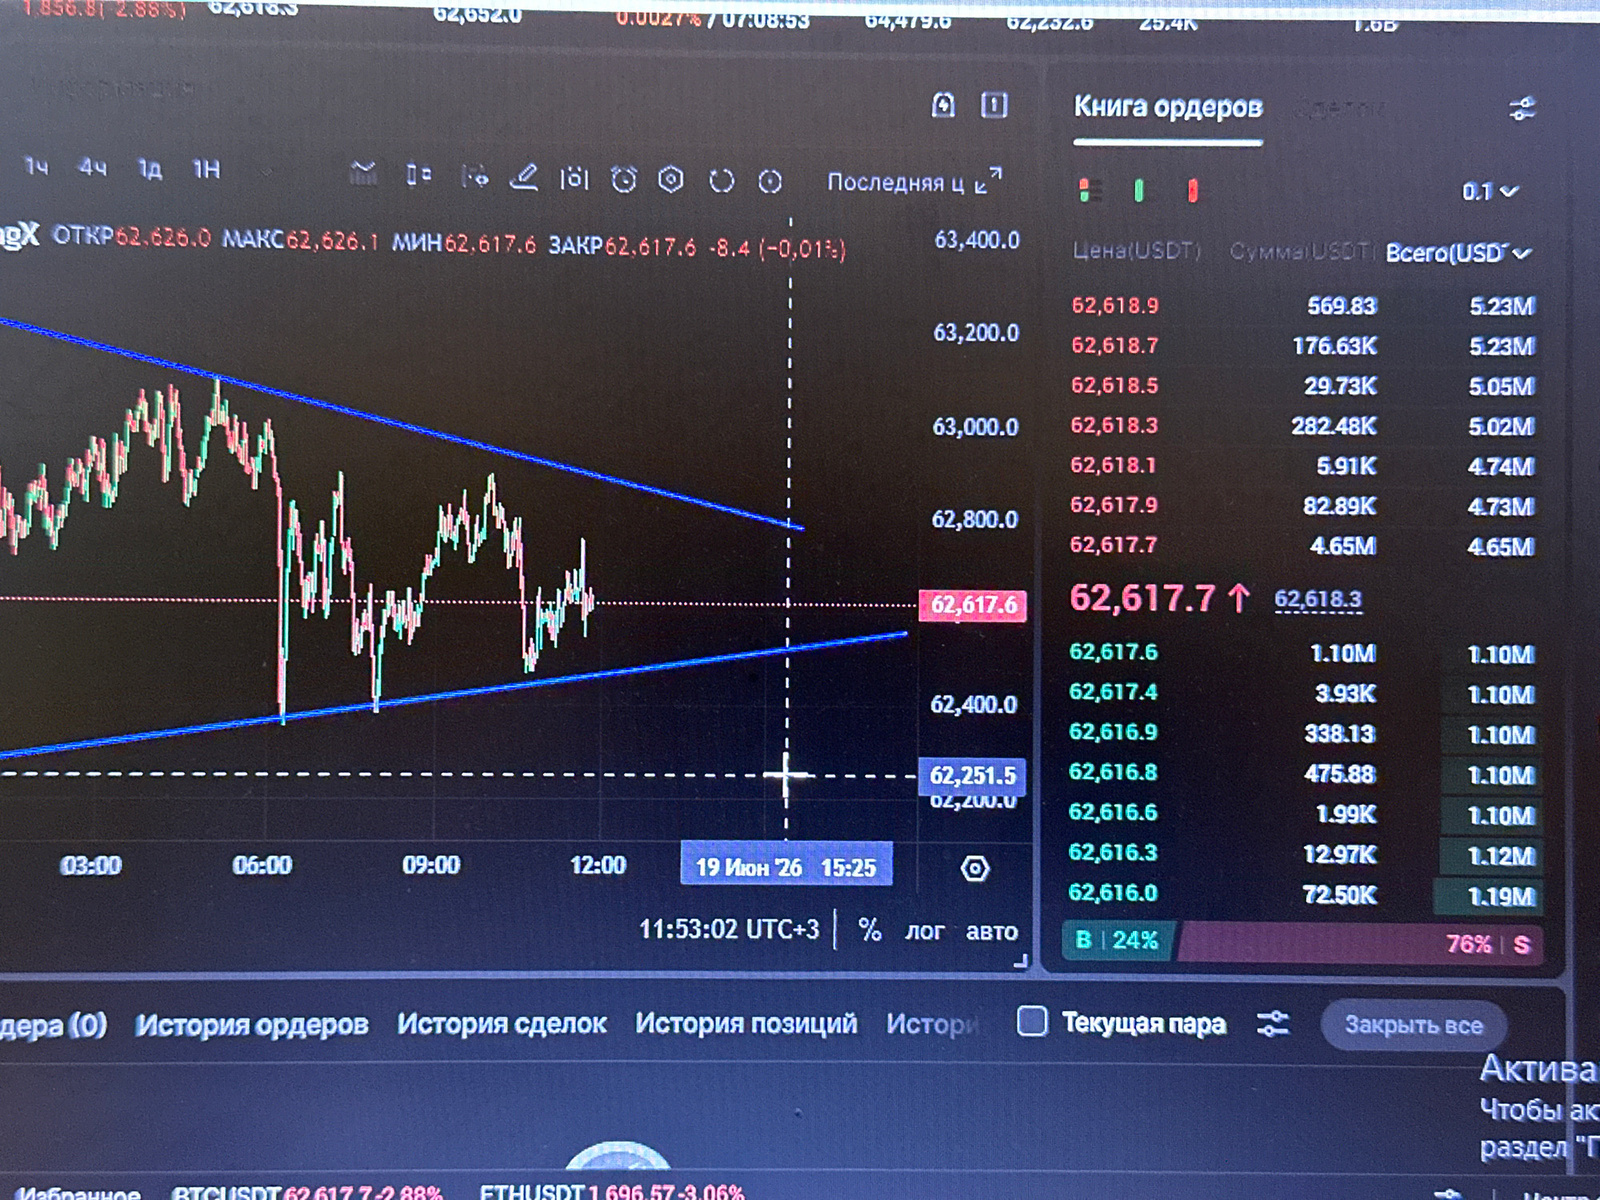
The image displays a screenshot of a cryptocurrency trading platform. A candlestick chart showing price fluctuations of a cryptocurrency is visible on the left side. The chart is overlaid with blue tr…read more
anxiety
uncertainty
tension
stress
nervousness
Technical
ID
a80df138-afd6-4cd5-b
Usage Rights
This media is free for non-commercial use with proper attribution.
Commercial use, AI/ML training, and derivative works are prohibited without explicit consent from the creator.
Licensed under CC BY-NC 4.0 with additional AI/ML restrictions. Full terms →