IMAGE

FM-R78jB3
Creator
Fri, Jun 19, 2026, 07:55 AM
5d ago
Unknown, Unknown
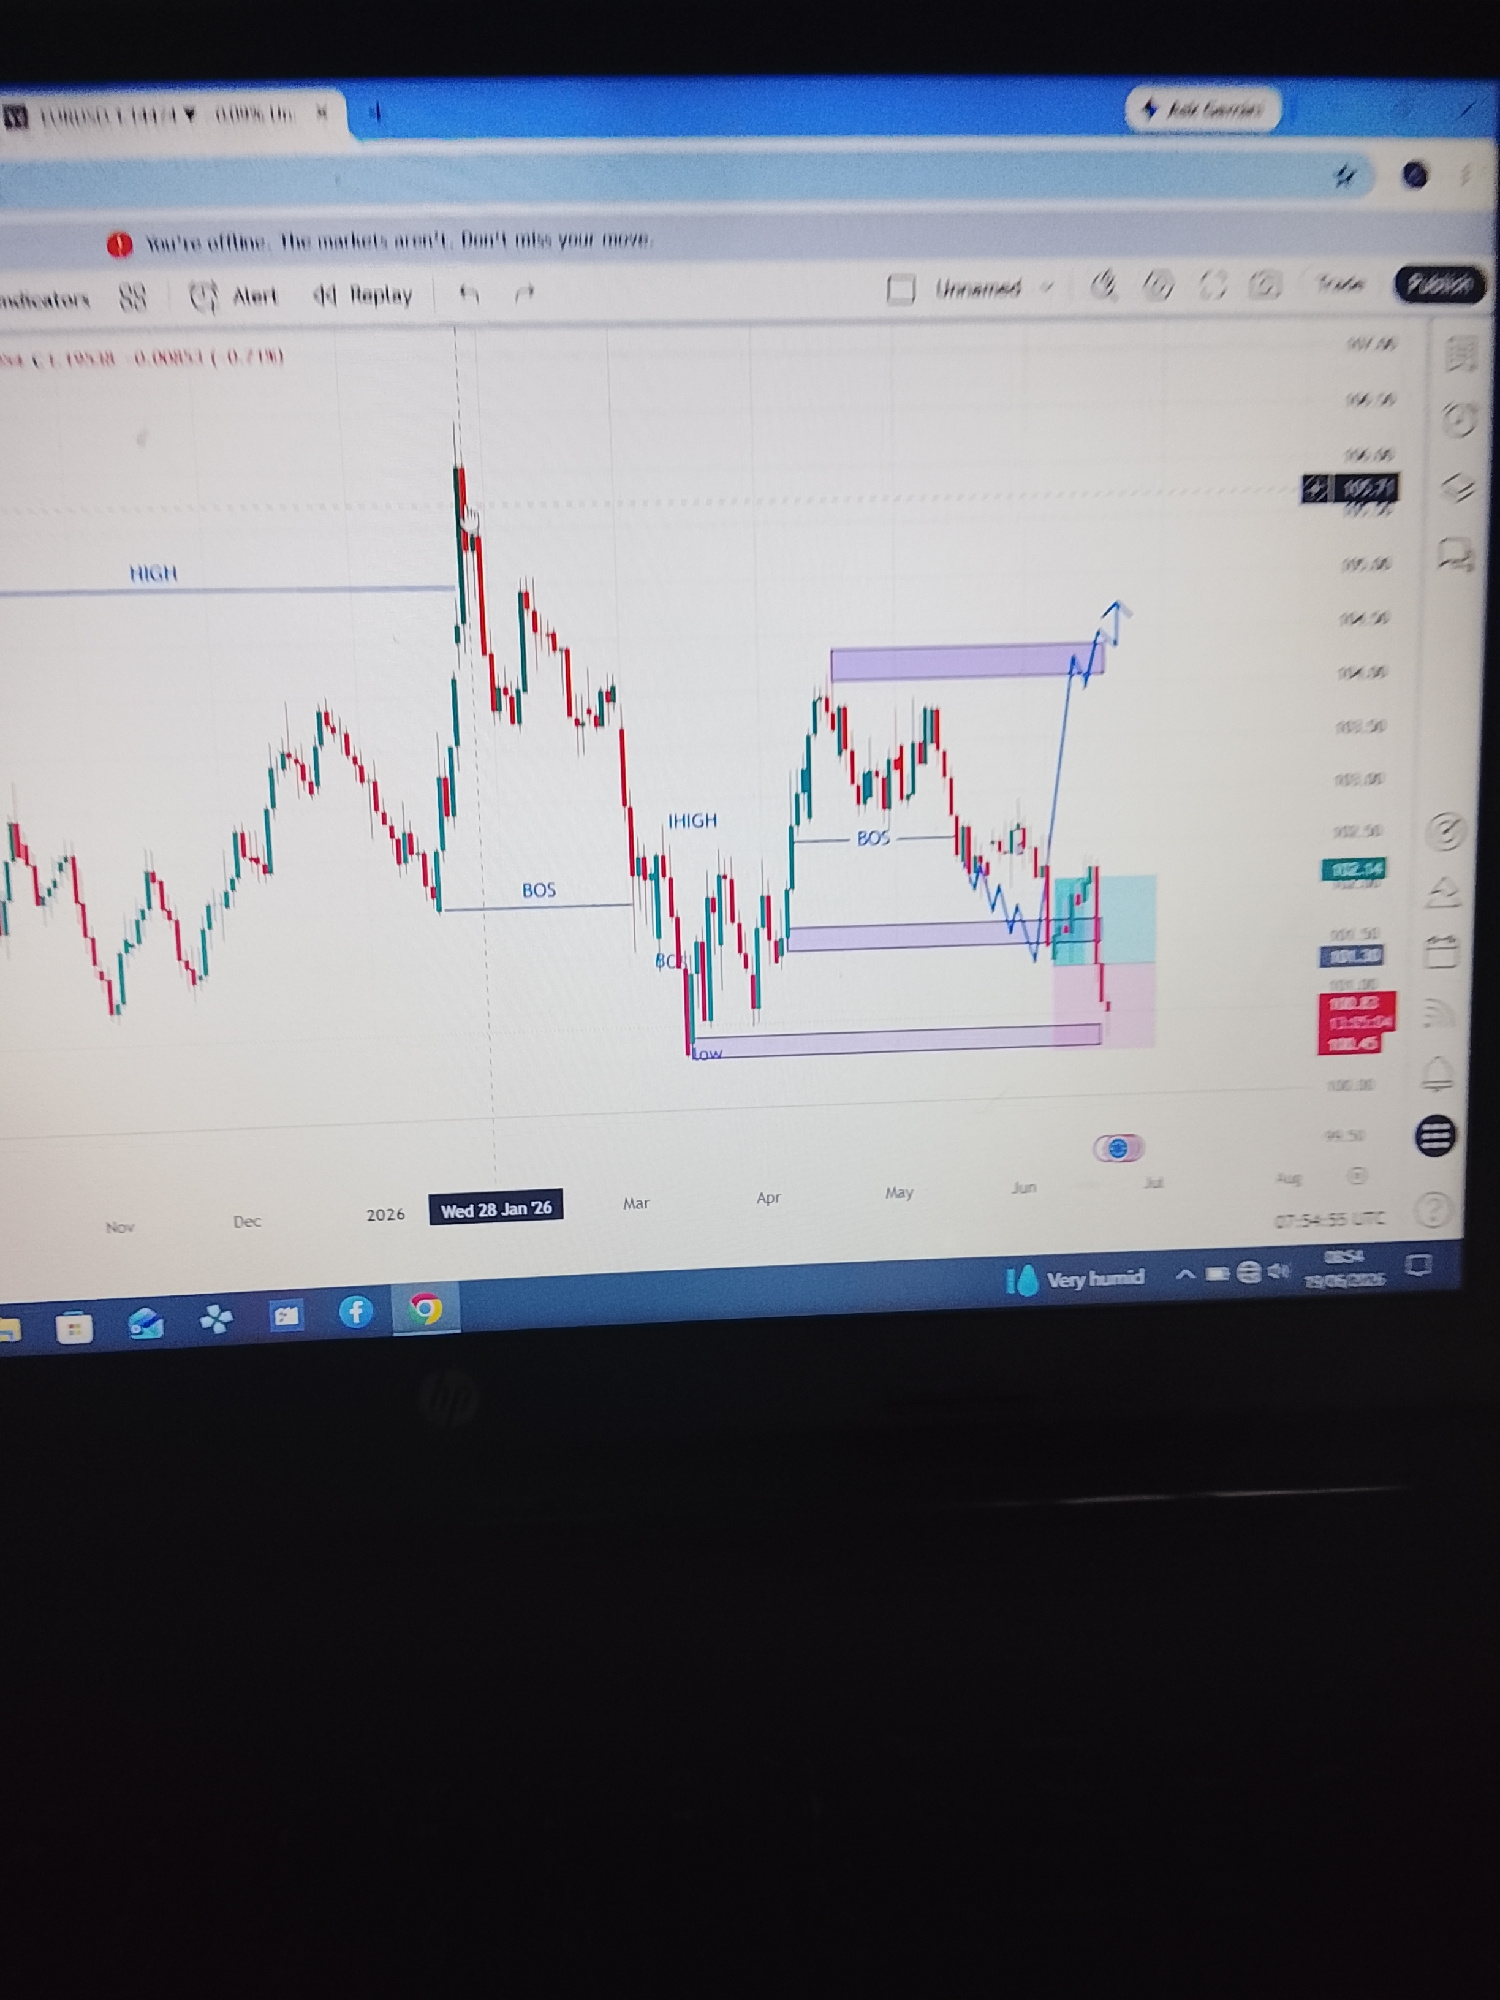
The image shows a laptop screen displaying a financial trading chart. The chart shows candlestick patterns, representing price movements of a financial instrument, likely a currency pair, indicated by…read more
anxious
frustrated
focused
analytical
concerned
Technical
ID
cd98cbf9-3bdc-407b-8
Usage Rights
This media is free for non-commercial use with proper attribution.
Commercial use, AI/ML training, and derivative works are prohibited without explicit consent from the creator.
Licensed under CC BY-NC 4.0 with additional AI/ML restrictions. Full terms →