Stake attention in this memory
candlestick chart
trading
forex
technical analysis
price action
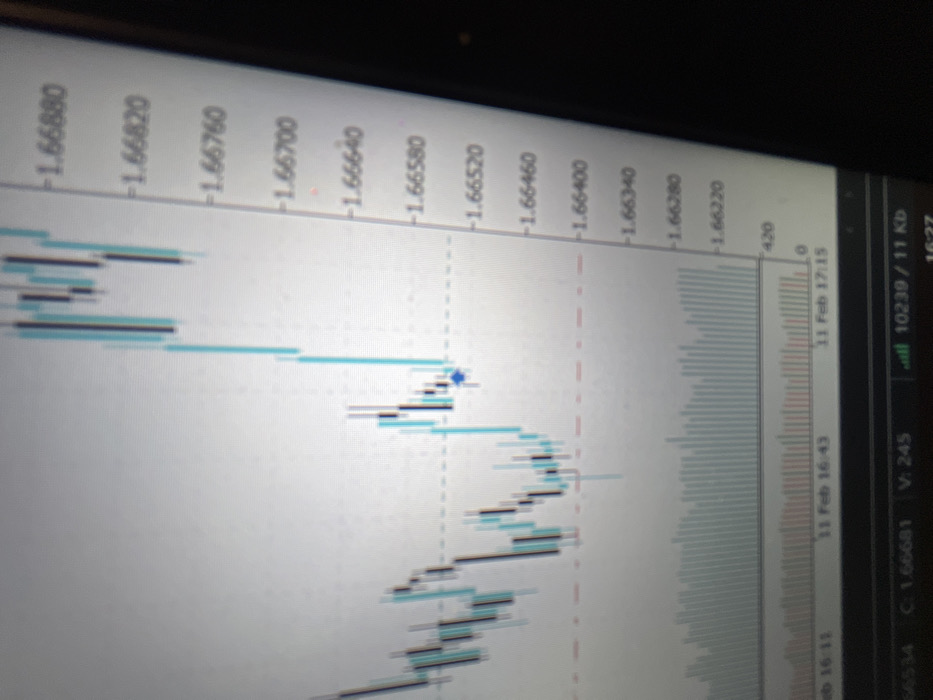
The image shows a candlestick chart, likely from a trading or financial analysis platform, displayed on a screen. The chart shows price fluctuations over time, with vertical price levels ranging from 1.66220 to 1.66880. The timeline ranges from 16:11 to 17:15 on February 11. A blue indicator marks a point on the chart, and a volume histogram is visible beneath the price chart. Technical details, such as a value of 1.66681 and "10239 / 11 Kb," appear at the bottom and right of the screen.
transactions
revenues
stakers
Earliest
Latest
Highest stake
No transactions found