Stake attention in this memory
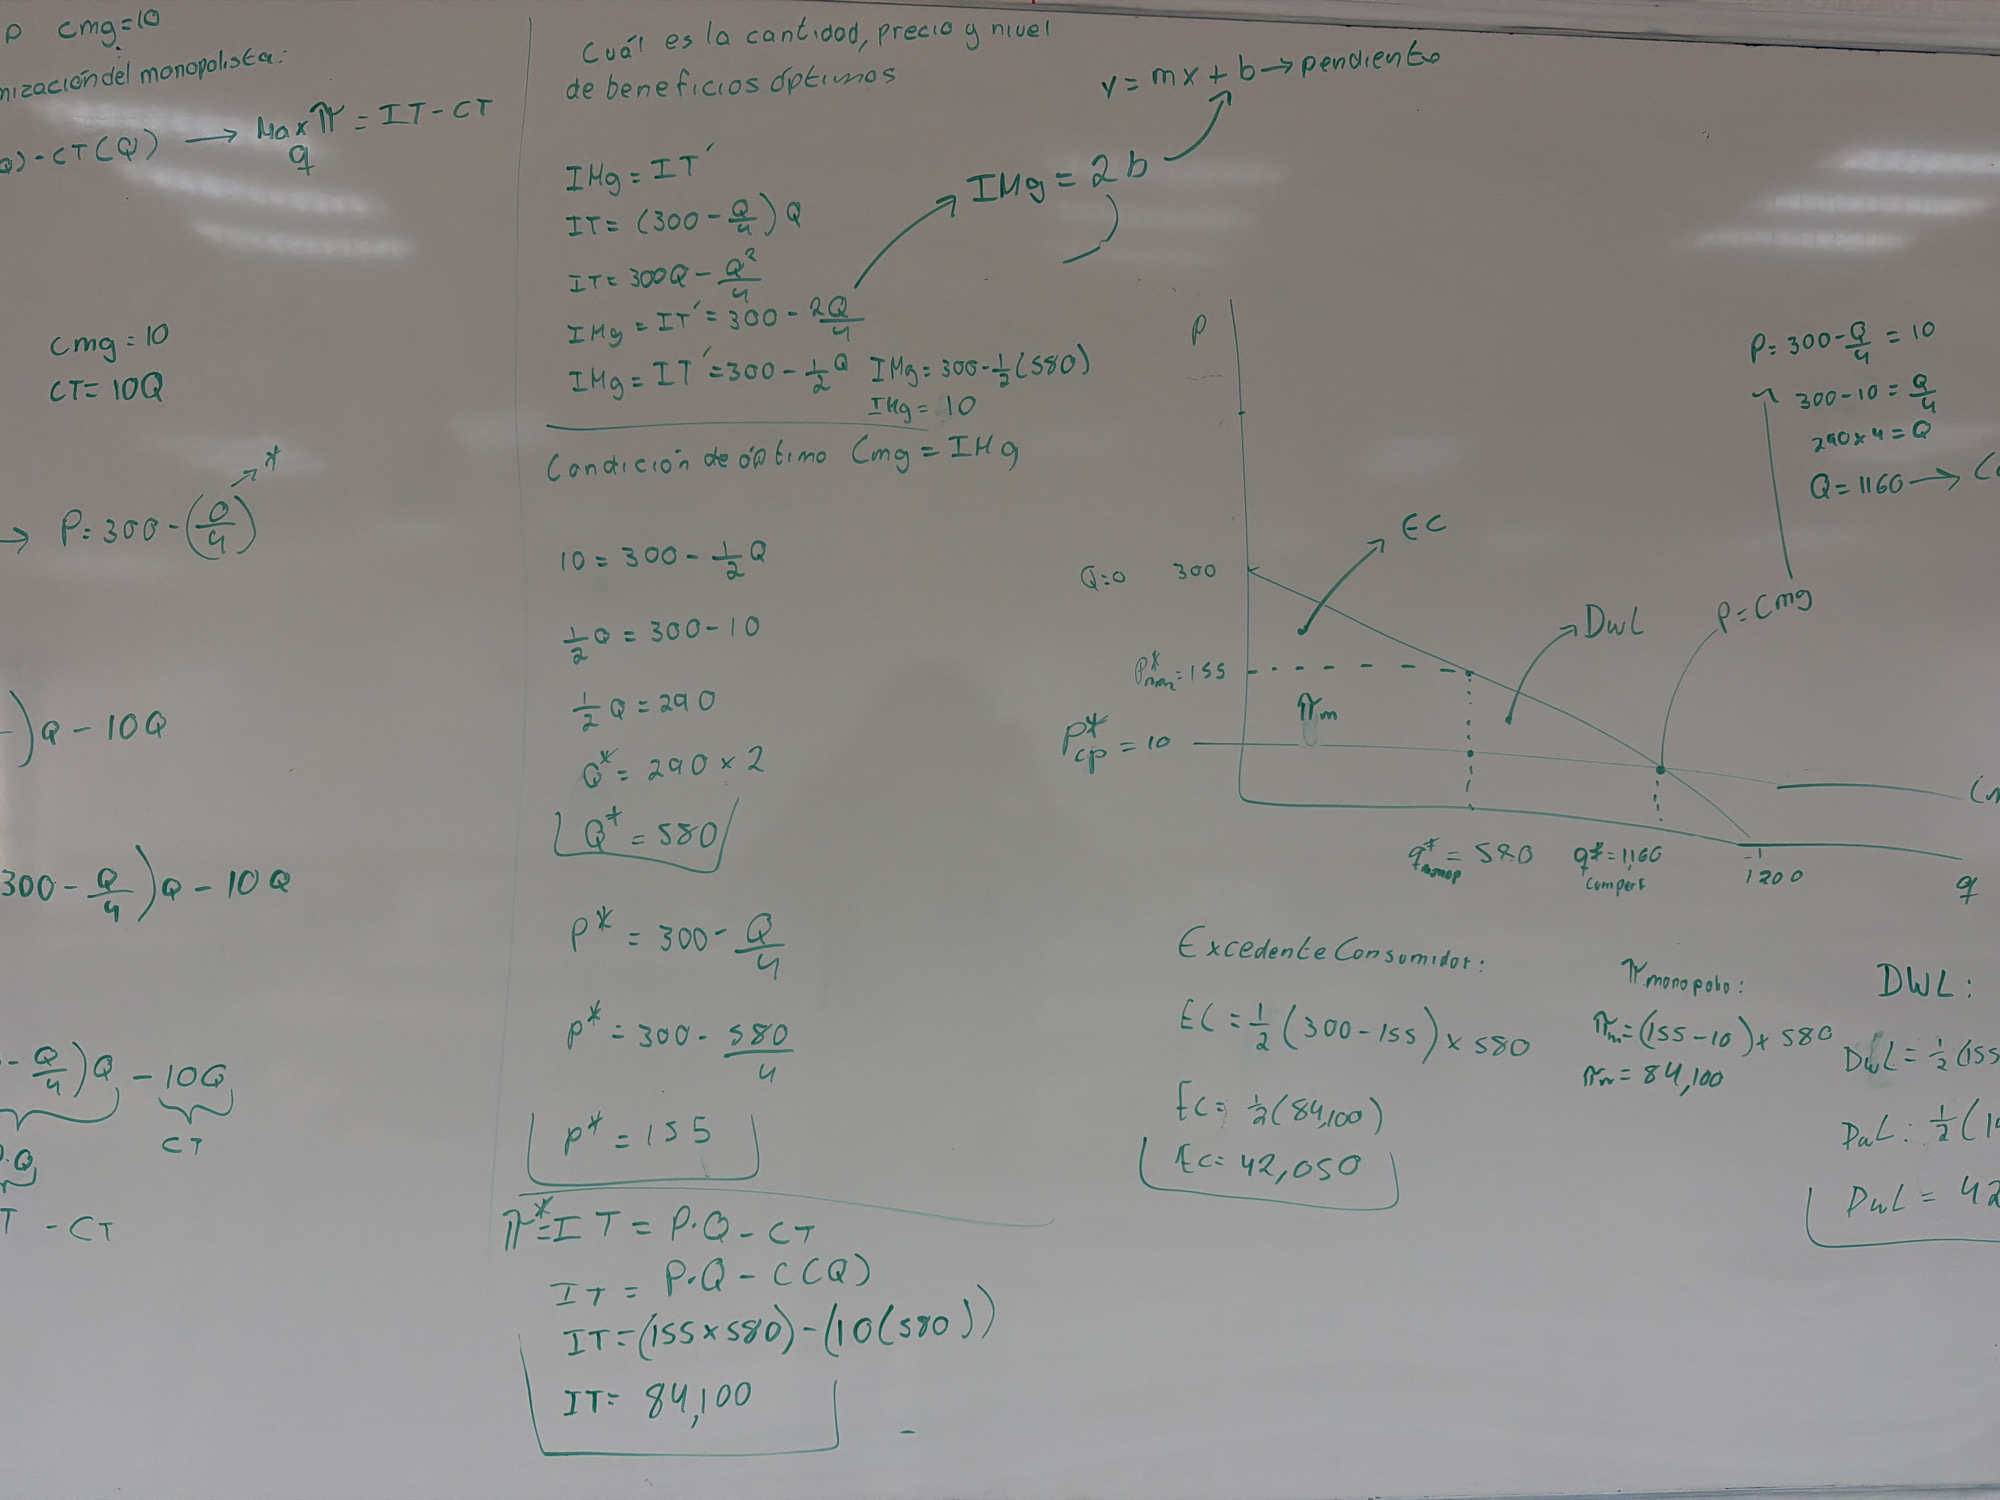
The image shows a whiteboard filled with handwritten equations, graphs, and calculations related to economics, specifically dealing with monopoly concepts and optimal benefit analysis. Mathematical expressions, such as "IMg = IT'," "IT = (300 - Q/4)Q," and "y = mx + b -> pendiente," are written in green marker, along with diagrams. These calculations cover concepts like marginal revenue, total revenue, consumer surplus, deadweight loss, and profit maximization. The whiteboard features a graph illustrating the demand curve, marginal cost curve, and marginal revenue curve, depicting the optimal quantity and price points for both monopoly and competitive scenarios. Calculations for consumer surplus (EC), deadweight loss (DWL), and monopolist profit are also present. Overall, the whiteboard appears to be part of an economics lecture or problem-solving session, focusing on the analysis of market structures, particularly the case of a monopoly.
No transactions found