Stake attention in this memory
Analytical
Organized
Calm
Structured
Informative
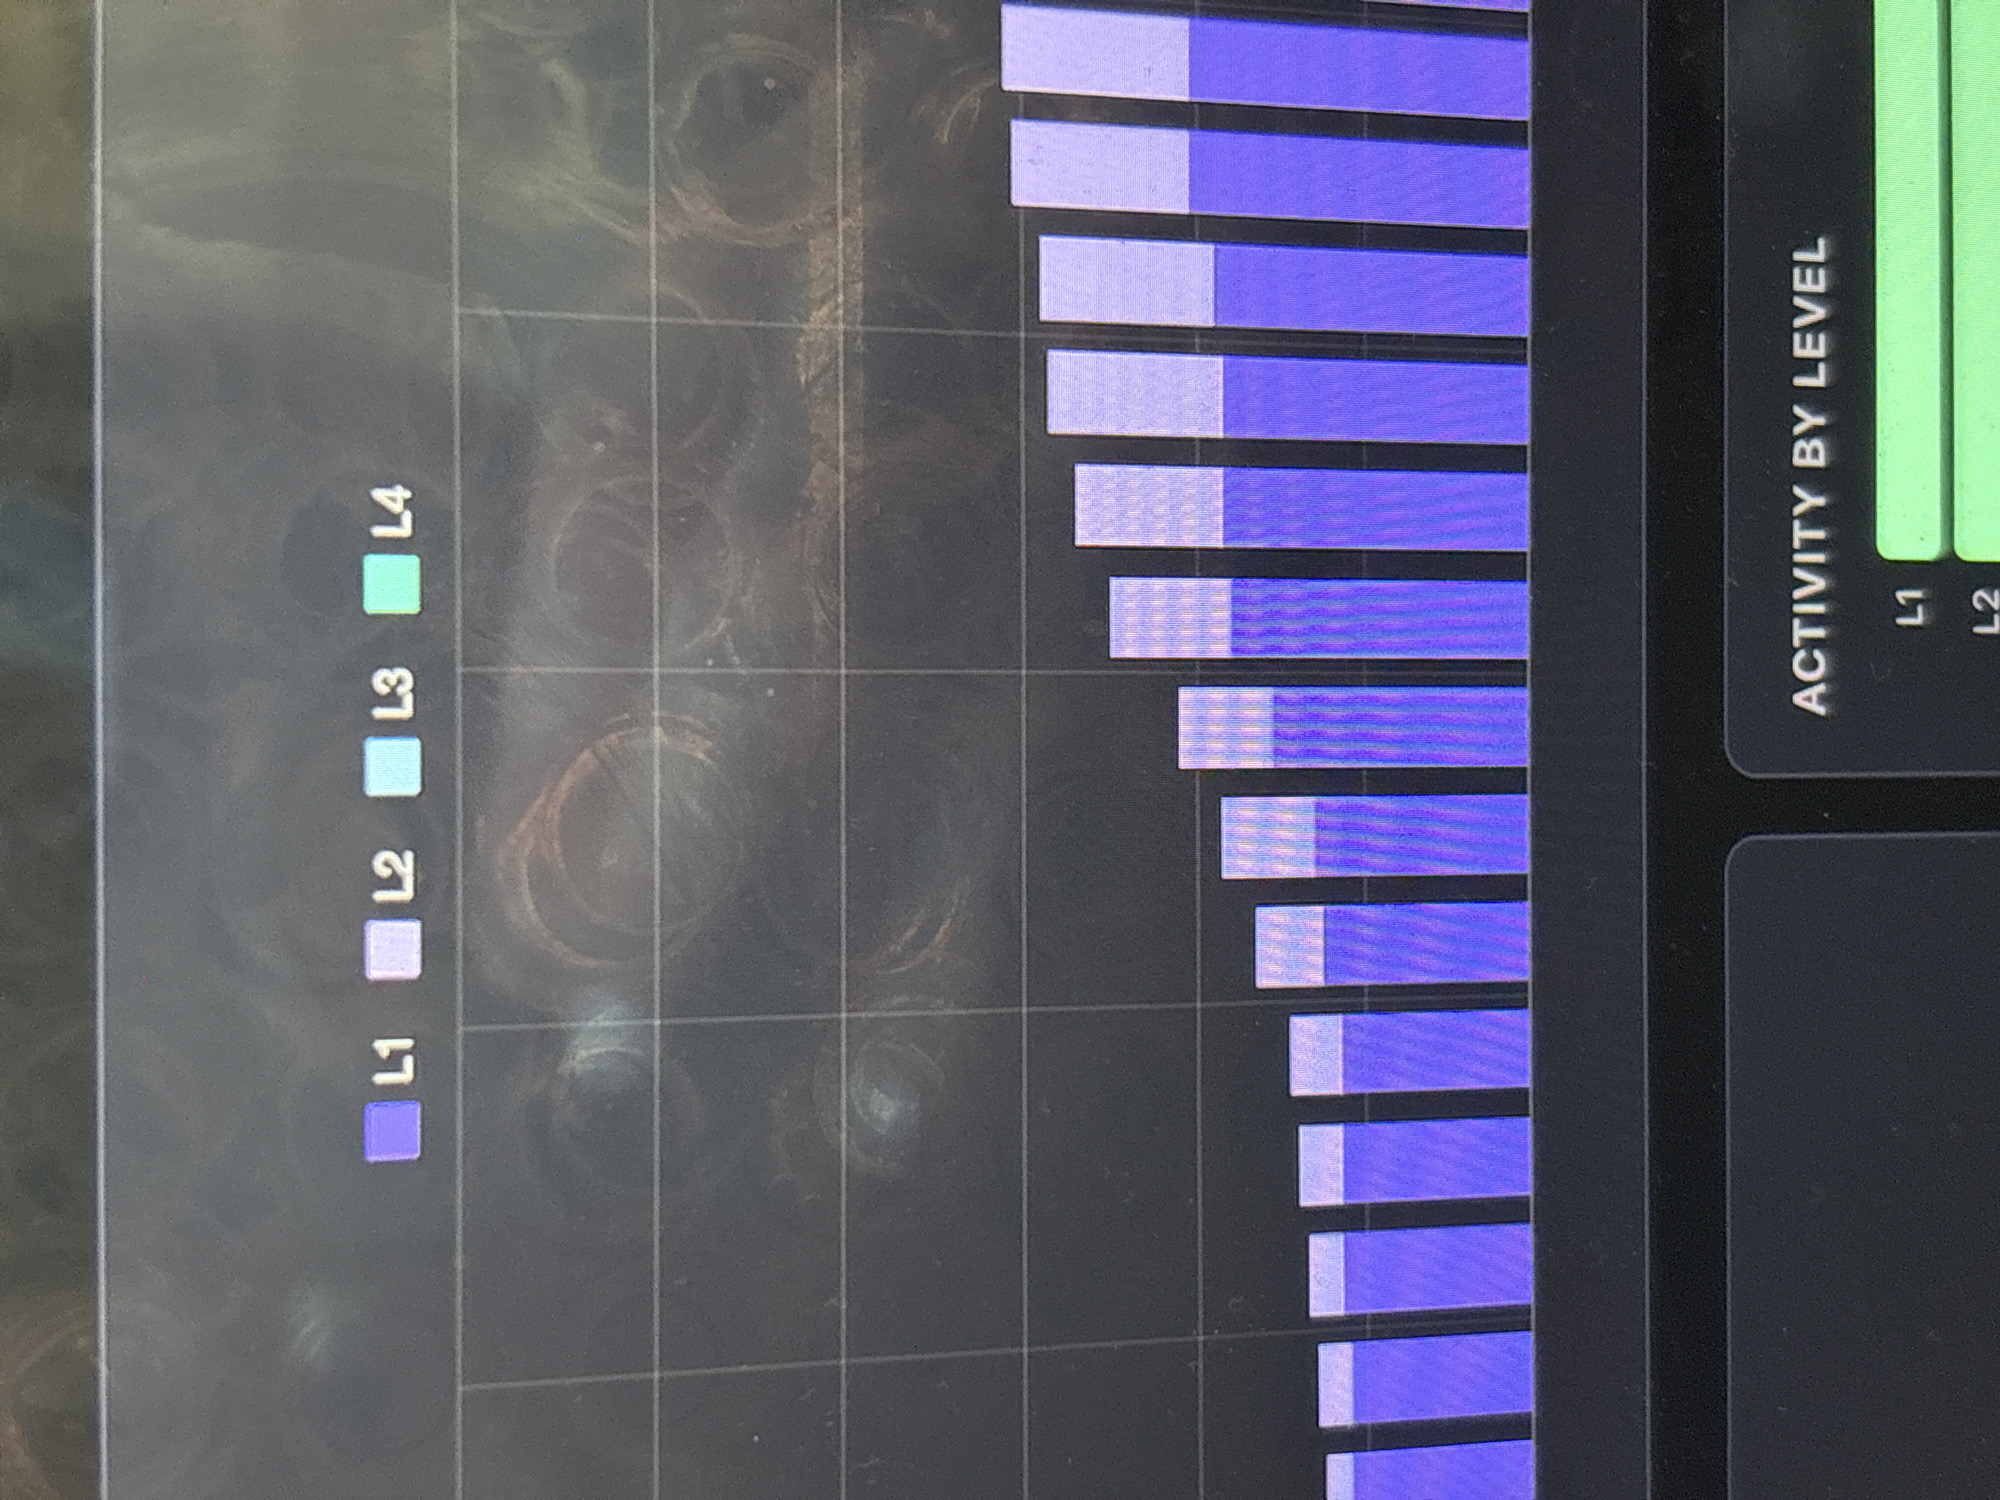
The image shows a digital display of activity levels by level, with L1, L2, L3, and L4 represented by different colors. A bar graph displays the activity for each level. The image is a close-up of a computer screen displaying this graph, there is no location data.
transactions
revenues
stakers
Earliest
Latest
Highest stake
No transactions found