
Stake attention in this memory
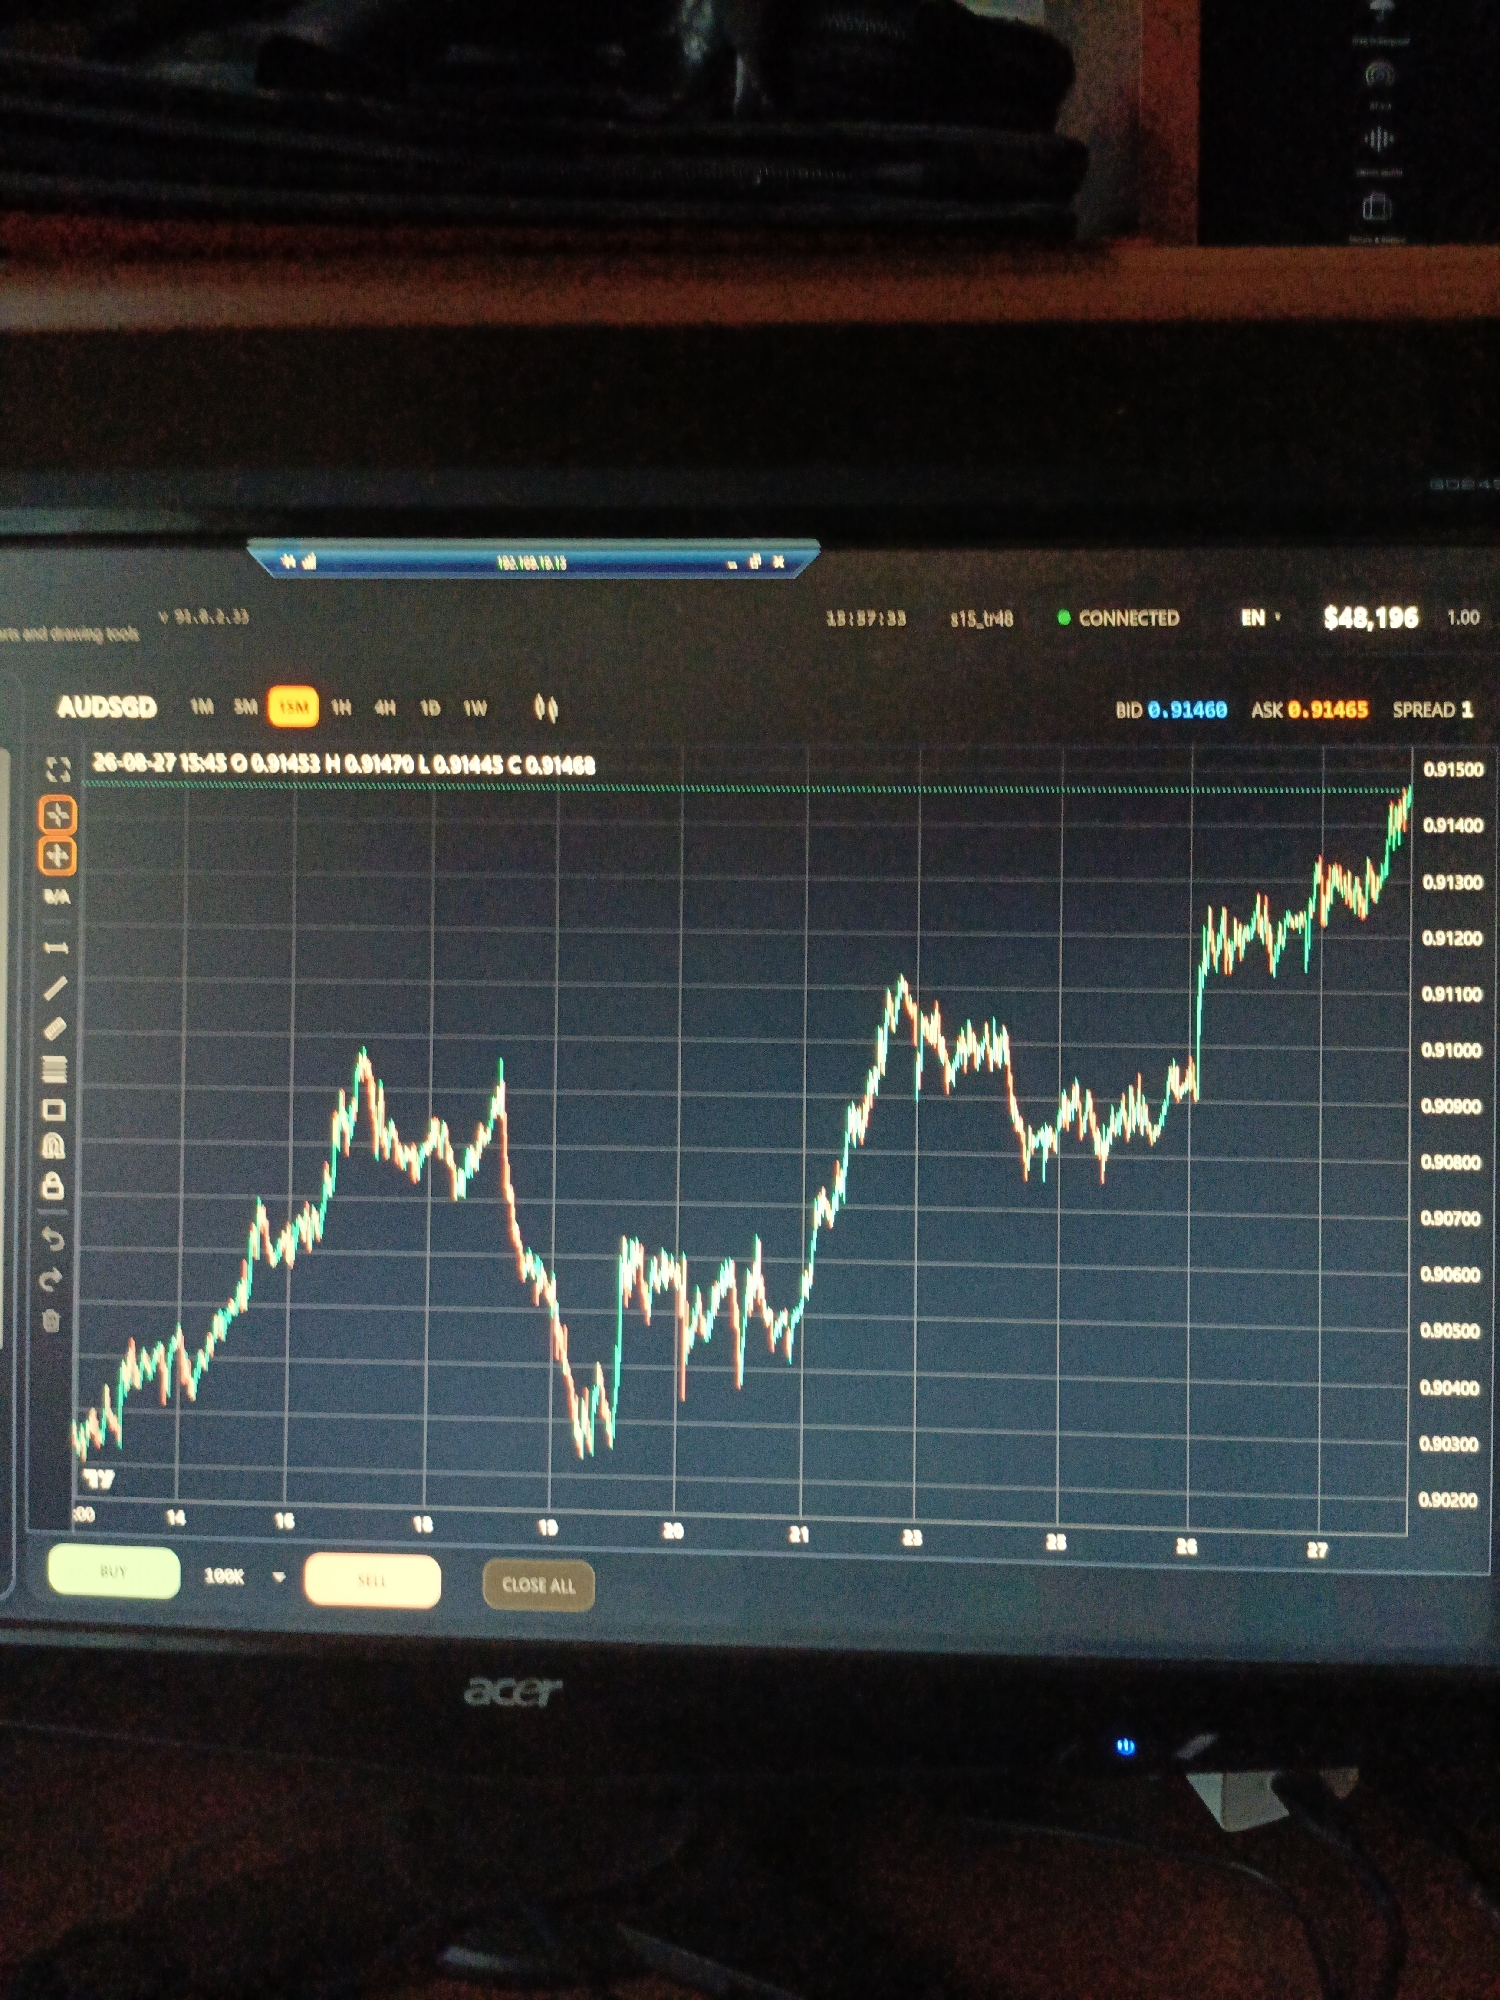
The image displays a close-up of a computer monitor showing a financial trading chart. The chart tracks the performance of AUD/SGD over a period labeled with numerical markers that appear to represent hours or days, ranging from 13 to 27. The price axis on the right side of the chart shows values fluctuating between approximately 0.90200 and 0.91500. Green and red candlestick lines indicate price movements. At the top of the screen, there is a status bar with network information and other indicators. Below the chart, there are buttons labeled "BUY", "SELL", and "CLOSE ALL", along with a quantity indicator. The overall environment is dark, suggesting the photo was taken in low light conditions. The computer monitor itself is displaying the trading interface, and the brand name "acer" is visible on the bezel below the screen. There are no people visible in the image. The location of Ухманы, Russia, is not discernible from the provided image.
Loading AttnAds…
No transactions found