
Sign in
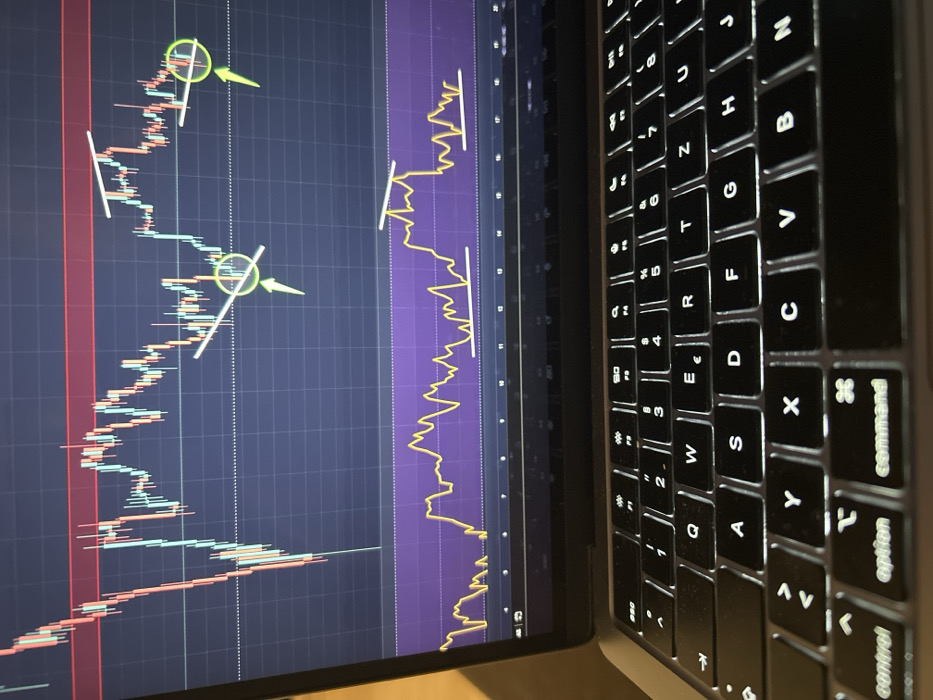
The image captures a close-up, angled view of a laptop, likely a MacBook, with its screen displaying financial charts and its backlit keyboard prominent in the foreground. The setting appears to be indoors, under dim lighting conditions, highlighting the glow from the screen and keyboard.

The laptop's screen shows two main technical analysis charts on a dark, gridded background. The upper chart is a candlestick chart, illustrating price action with red and light blue/cyan colored candlesticks. On the left side of this chart, there's a broad vertical red band. Several white diagonal lines and shorter horizontal white lines are overlaid on the candlesticks, suggesting trend lines or support/resistance levels. Two specific points on this chart are marked with green circular highlights that have a diagonal line through them, accompanied by green arrows pointing to these areas, indicating points of interest or analysis.

Below the candlestick chart, a secondary chart is visible. It features a yellow line graph plotted against a purple background, also marked with horizontal white lines, likely representing an oscillator or indicator.

The laptop's keyboard, which occupies a significant portion of the right side of the image, is brightly backlit, illuminating the characters on the keys. The layout is a standard English QWERTY keyboard. Clearly visible keys include "command," "option," "control," "shift," "caps lock," "tab," "return," "delete," along with various letter and number keys such as "Q," "W," "E," "R," "T," "Y," "U," "I," "O," "P," "A," "S," "D," "F," "G," "H," "J," "K," "L," "Z," "X," "C," "V," "B," "N," "M," and the number row from "1" to "0." The overall composition suggests an individual engaged in financial market analysis or observation.
A3A✨

Feb 18, 2026, 5:18 PM

Berlin, Germany

Stake attention in this memory

laptop
stock market chart
technical analysis
computer screen
keyboard

The image captures a close-up, angled view of a laptop, likely a MacBook, with its screen displaying financial charts and its backlit keyboard prominent in the foreground. The setting appears to be indoors, under dim lighting conditions, highlighting the glow from the screen and keyboard. The laptop's screen shows two main technical analysis charts on a dark, gridded background. The upper chart is a candlestick chart, illustrating price action with red and light blue/cyan colored candlesticks. On the left side of this chart, there's a broad vertical red band. Several white diagonal lines and shorter horizontal white lines are overlaid on the candlesticks, suggesting trend lines or support/resistance levels. Two specific points on this chart are marked with green circular highlights that have a diagonal line through them, accompanied by green arrows pointing to these areas, indicating points of interest or analysis. Below the candlestick chart, a secondary chart is visible. It features a yellow line graph plotted against a purple background, also marked with horizontal white lines, likely representing an oscillator or indicator. The laptop's keyboard, which occupies a significant portion of the right side of the image, is brightly backlit, illuminating the characters on the keys. The layout is a standard English QWERTY keyboard. Clearly visible keys include "command," "option," "control," "shift," "caps lock," "tab," "return," "delete," along with various letter and number keys such as "Q," "W," "E," "R," "T," "Y," "U," "I," "O," "P," "A," "S," "D," "F," "G," "H," "J," "K," "L," "Z," "X," "C," "V," "B," "N," "M," and the number row from "1" to "0." The overall composition suggests an individual engaged in financial market analysis or observation.

Loading AttnAds…

transactions
revenues
stakers
Earliest
Latest
Highest stake

No transactions found

More from this user

More from Berlin

A3A✨

Feb 18, 2026, 5:18 PM

Berlin, Germany

Licensed under Creative Commons Attribution 4.0 International License. You are free to share and adapt this content with proper attribution.