
Stake attention in this memory
analytical
informative
historical
economic
neutral
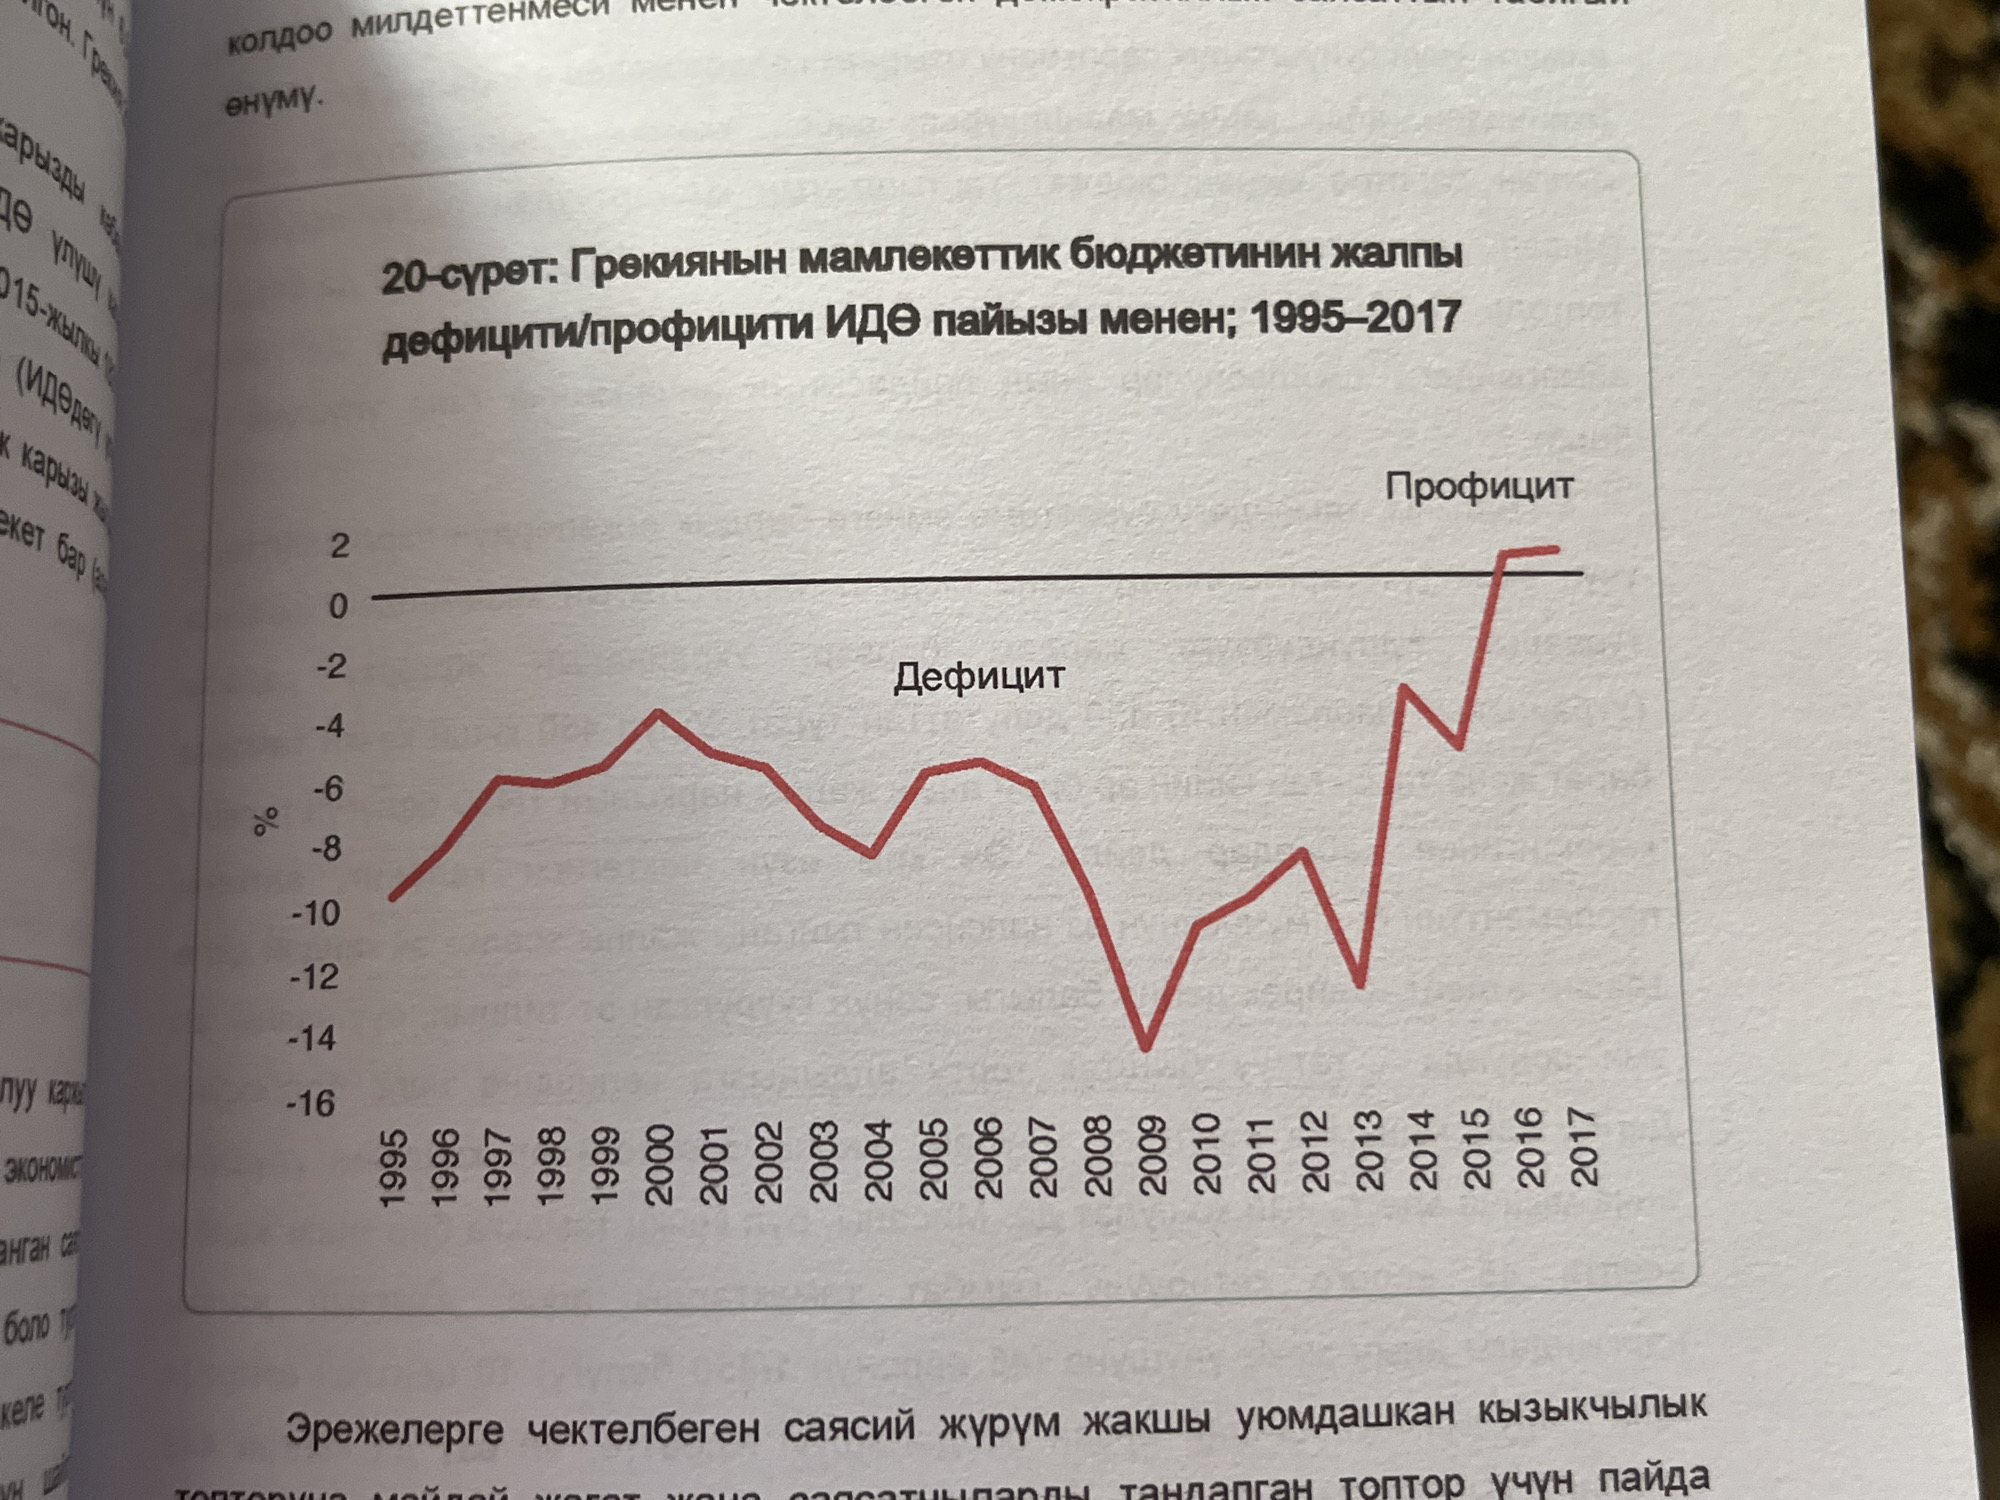
The image shows a graph with a red line plotting data points from 1995 to 2017. The y-axis is labeled with percentages ranging from -16 to 2, with increments of 2. The x-axis represents years. The graph title is "20-сурет: Грекияның мамлекеттік бюджетінің жалпы дефицити/профицити ИДӨ пайызыменен; 1995-2017". To the left of the graph, a list of years from 1995 to 2017 is provided. The words "Дефицит" and "Профицит" are written vertically along the bottom of the graph, indicating deficit and surplus respectively. The background is a page from a book.
Loading AttnAds…
transactions
revenues
stakers
Earliest
Latest
Highest stake
No transactions found