
Stake attention in this memory
Anxious
Hopeful
Focused
Determined
Volatile
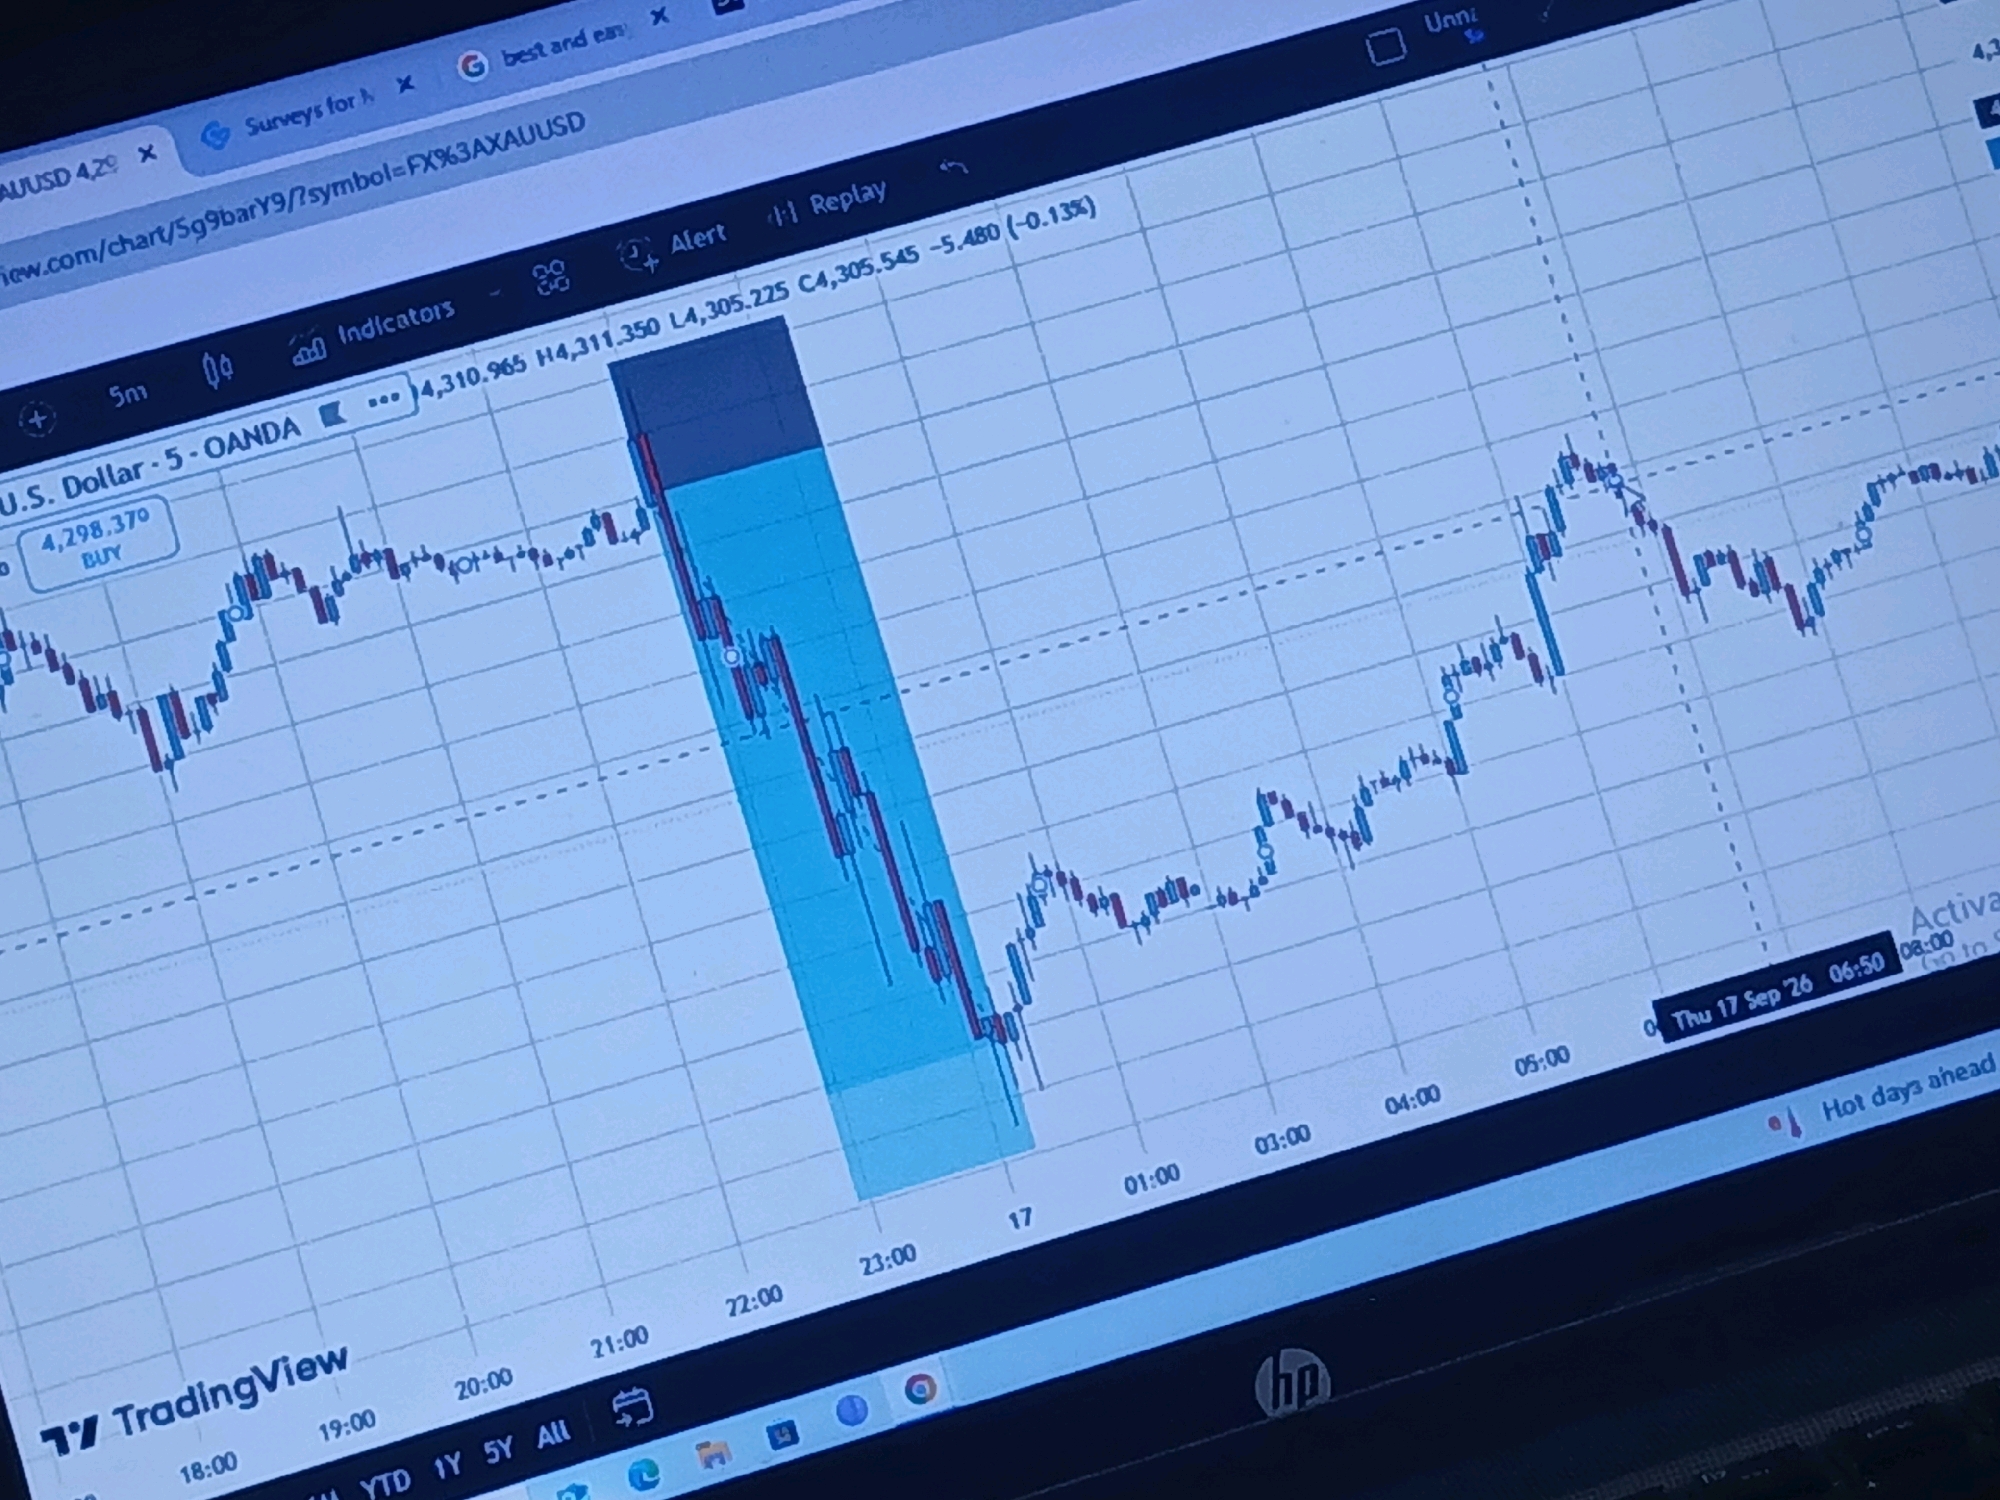
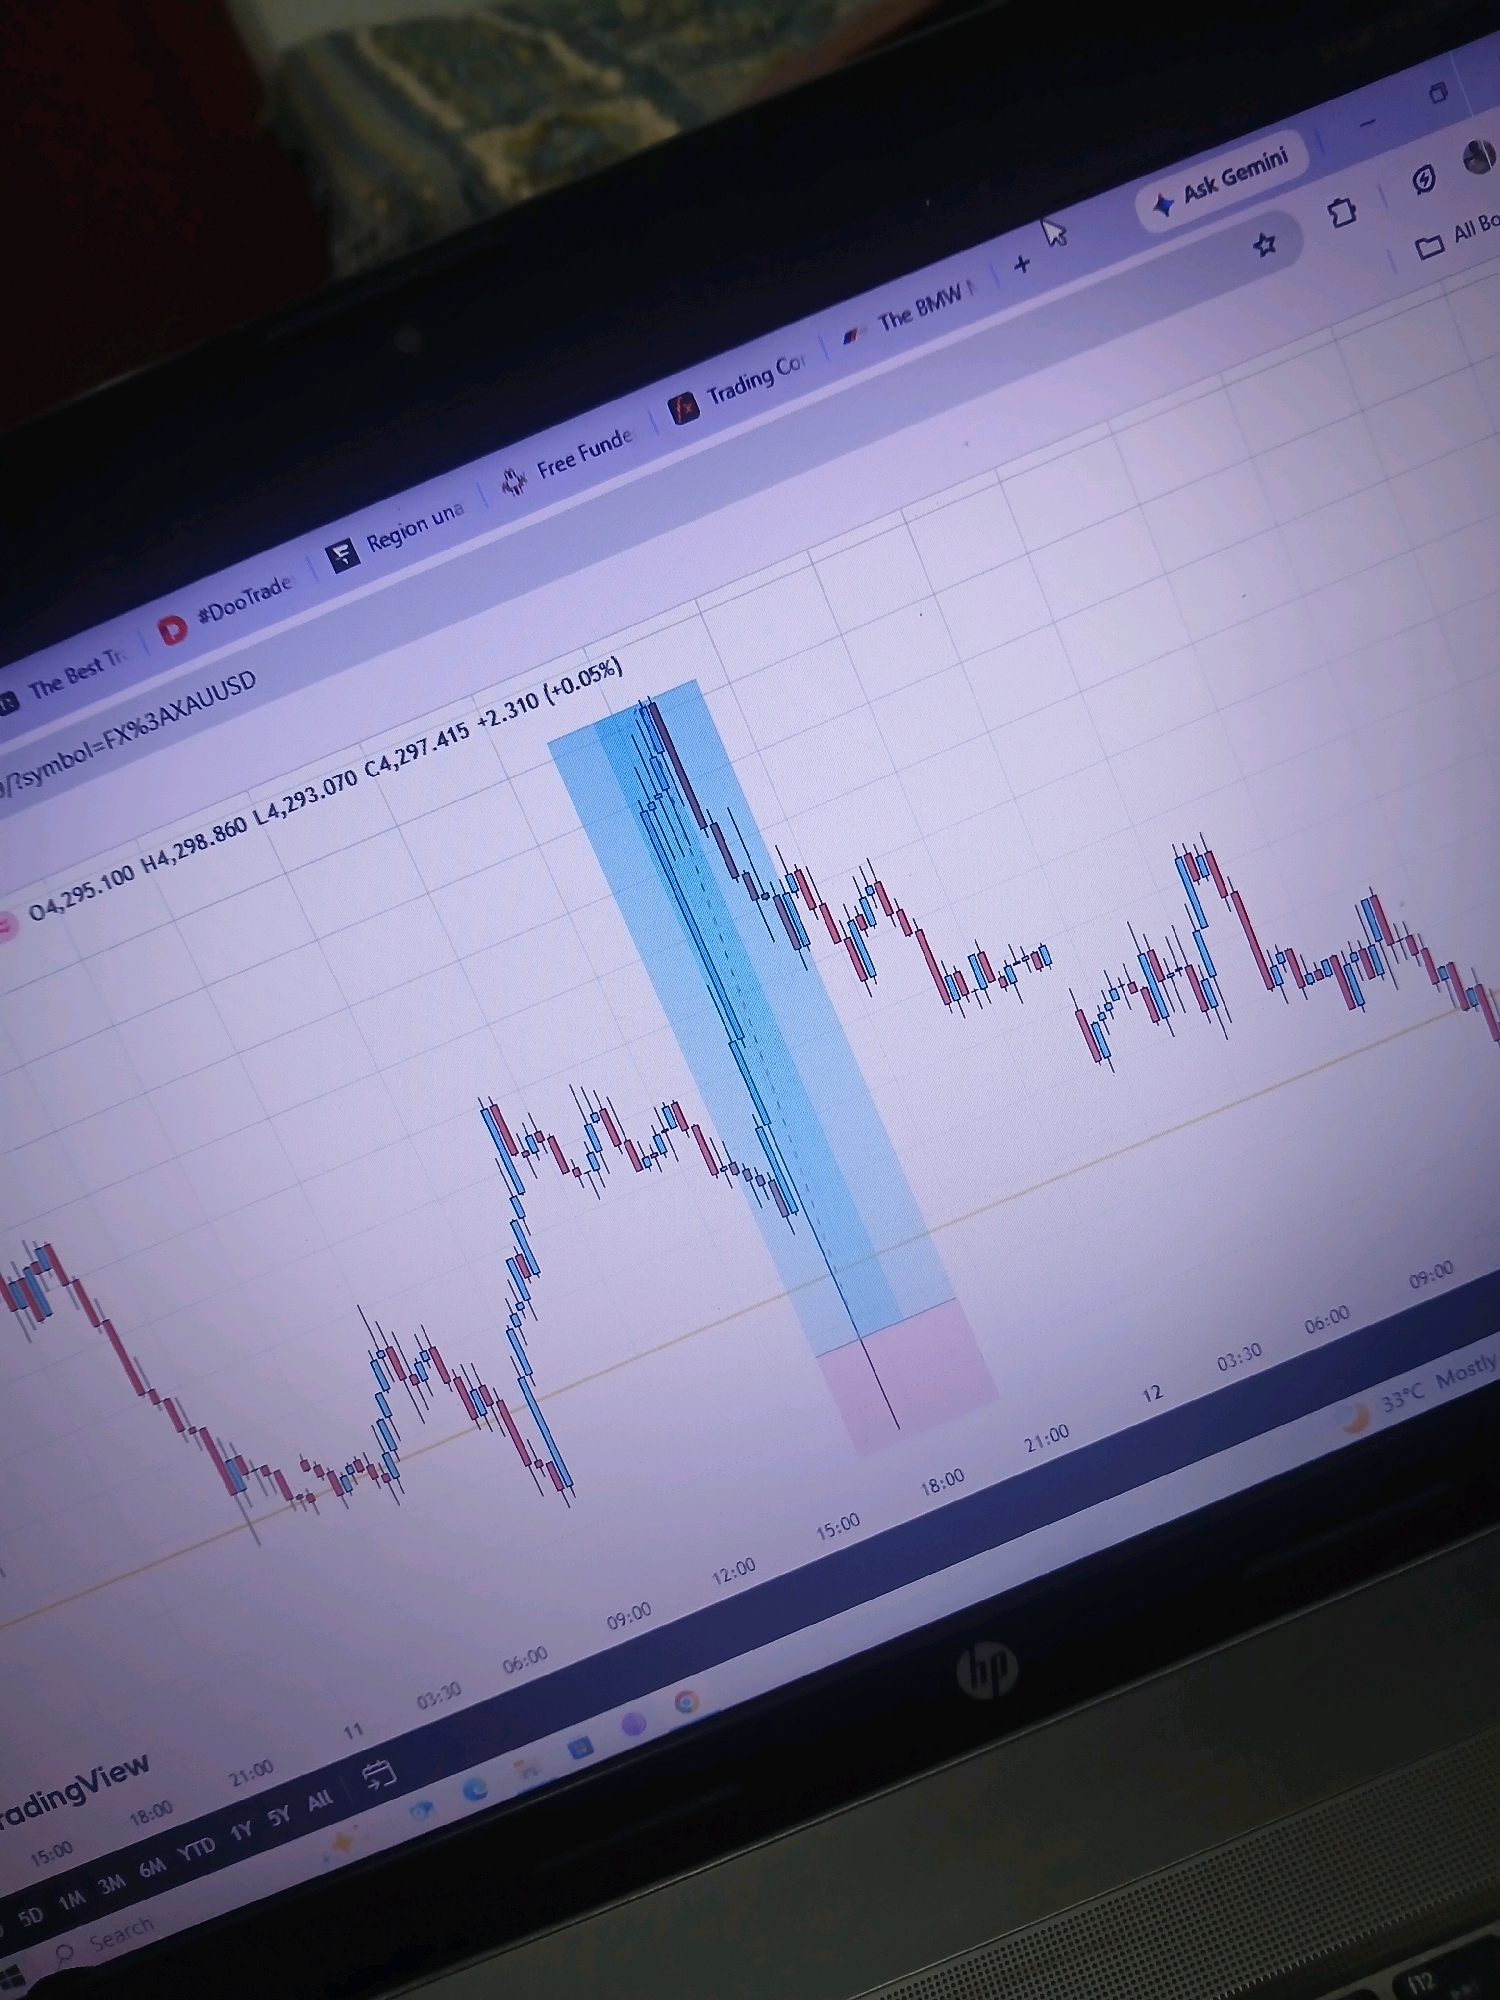
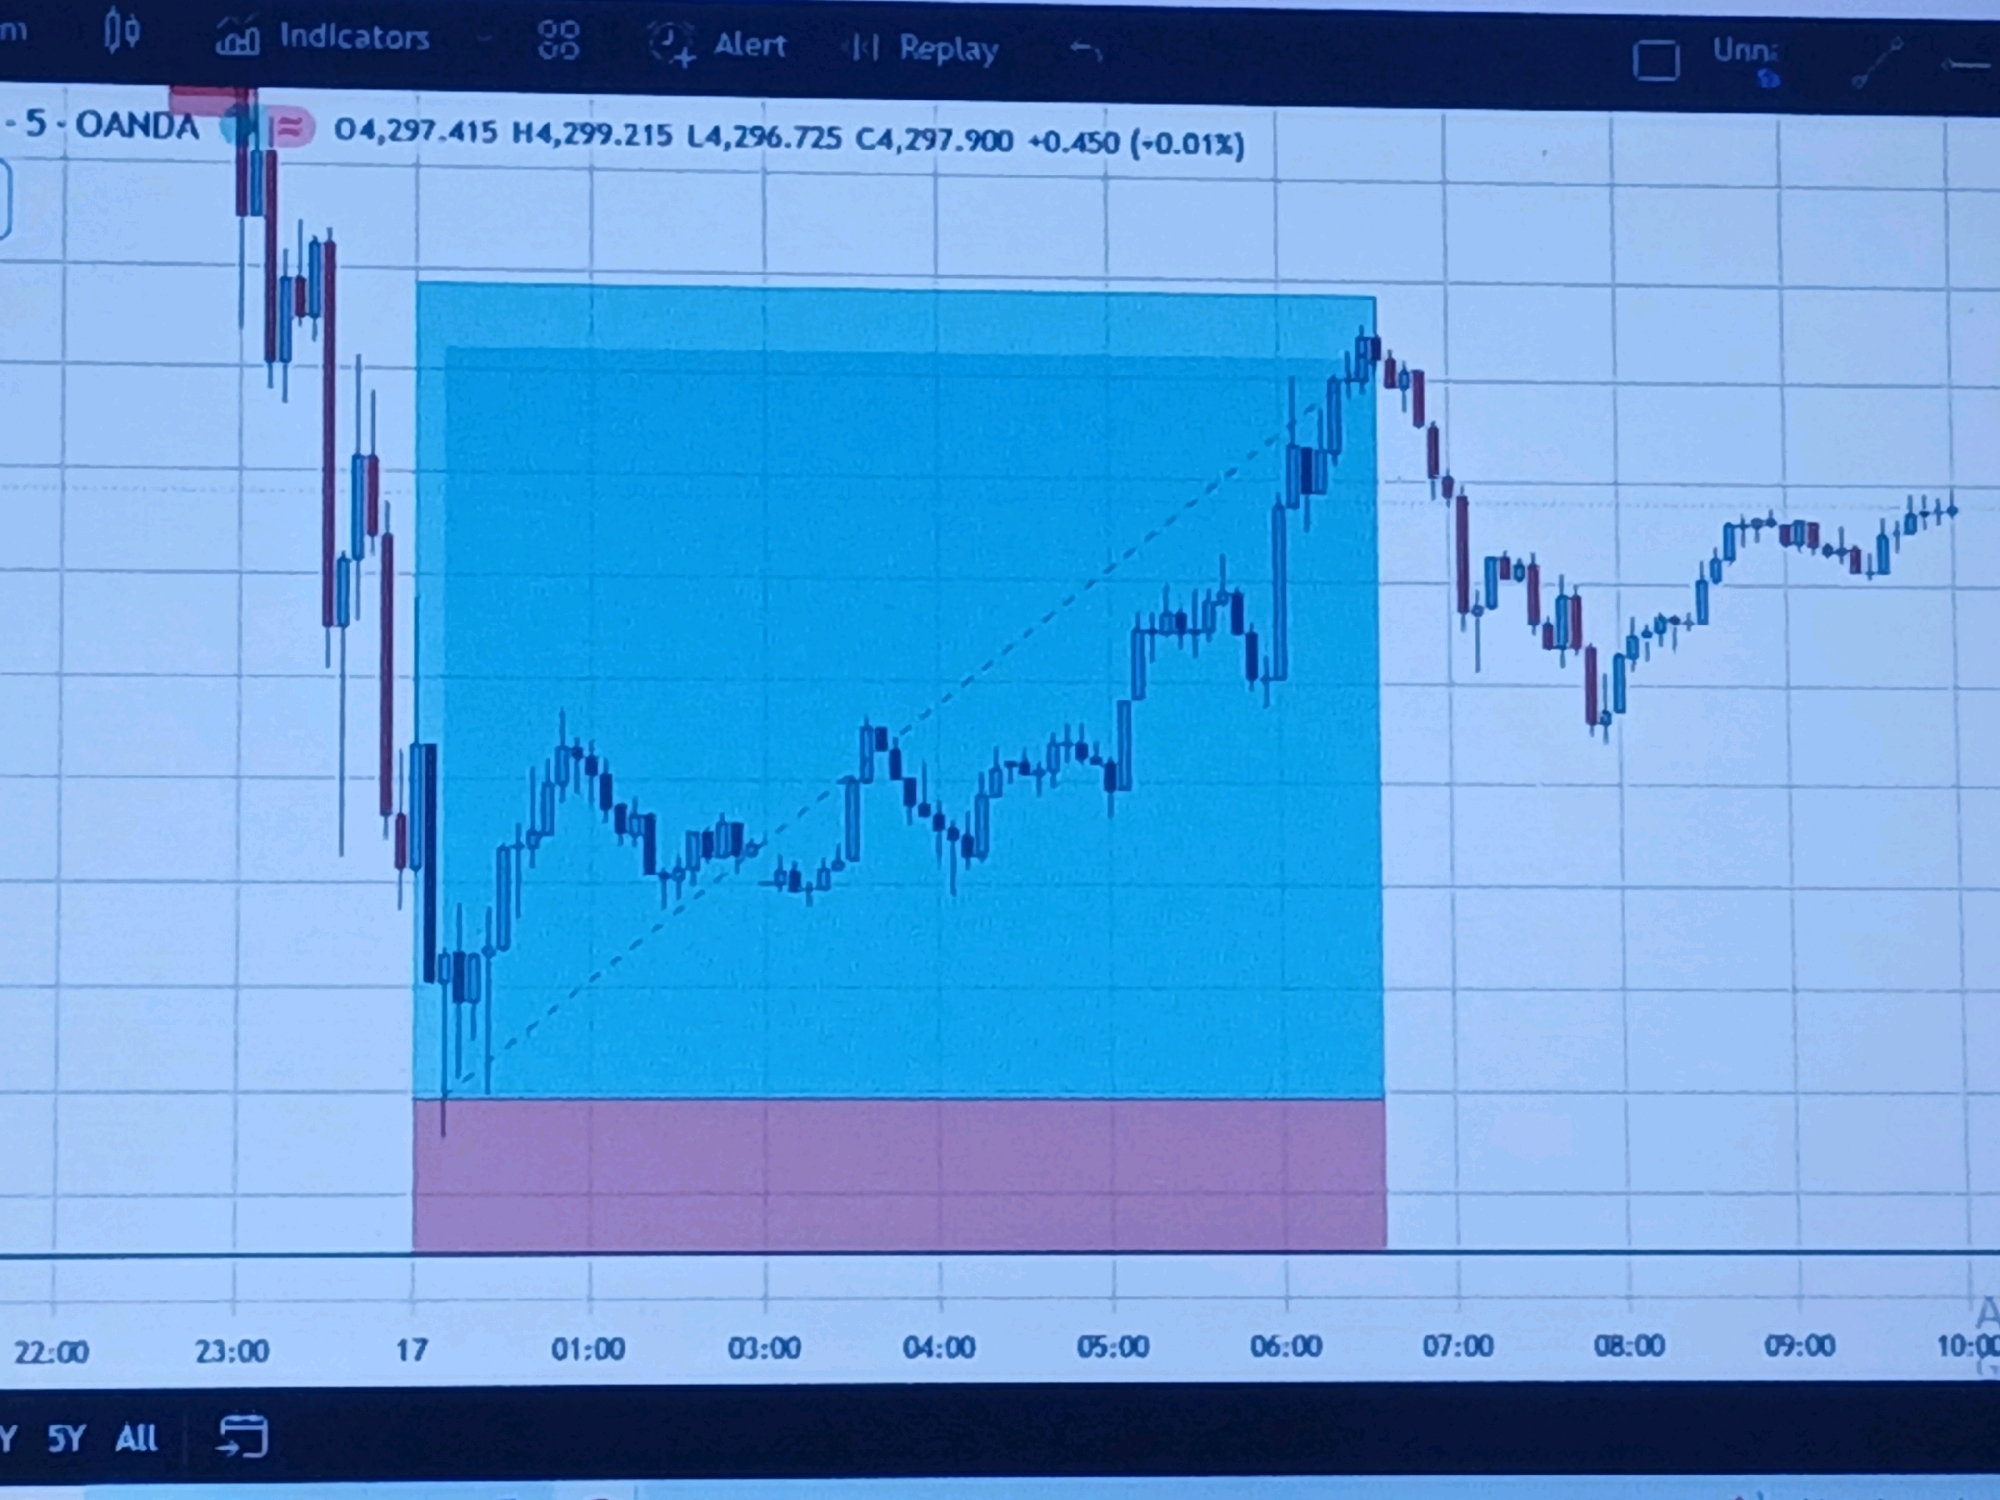
This is a close-up, eye-level, indoor shot of a computer monitor displaying a financial trading chart. The chart shows candlestick price movements over time, with a blue shaded area and a red shaded area superimposed on it. The blue area appears to represent a target or range, while the red area may indicate a stop-loss zone. The time axis at the bottom of the screen shows hours and minutes, spanning from 22:00 to 10:00. The top of the screen displays menu options like "Indicators," "Alert," and "Replay." The background is a light blue grid. There are no people or any other discernible environmental context visible.
Loading AttnAds…
transactions
revenues
stakers
Earliest
Latest
Highest stake
No transactions found