Nov 12, 2025
Stake attention in this memory
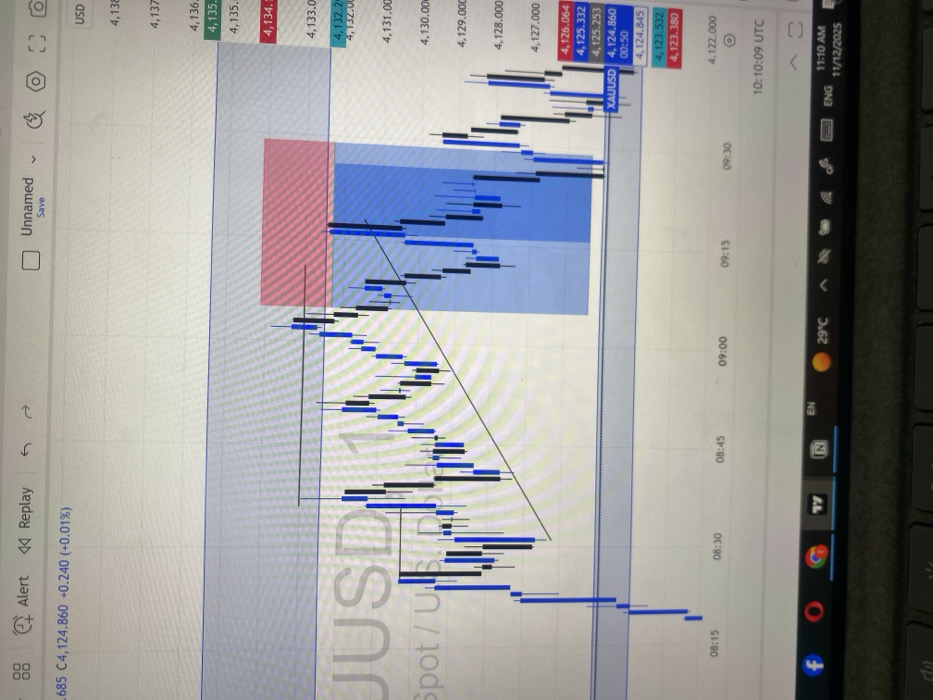
The image displays a close-up, slightly angled photograph of a laptop screen exhibiting a financial trading chart for XAUUSD (Gold/US Dollar spot price), located in Unknown, Unknown. The chart is a candlestick graph, showing price action over a short timeframe, approximately from 08:15 to 09:45 on the x-axis, with price values ranging from roughly 4,122.000 to 4,138.000 on the y-axis. Visible chart elements include black horizontal lines representing potential support and resistance levels, and two black diagonal trendlines, suggesting a preceding upward trend followed by a breakdown. A red rectangular overlay is positioned above the current price, indicating a potential stop-loss zone, while a larger blue rectangular overlay below the current price defines a potential take-profit area, consistent with a short-selling trade setup. The current XAUUSD price is listed as 4,124.860, alongside bid/ask values. The laptop's user interface is partially visible. The application's top bar contains options such as "Alert," "Replay," and "Unnamed." The bottom Windows taskbar shows icons for Facebook, Google Chrome, a TV application, an "N" icon, the language "EN," a temperature reading of "29°C," and the system time and date, "11:10 AM 11/12/2025." A segment of a dark grey keyboard is visible at the very bottom of the image. No individuals are present in the scene.
No transactions found
More from this user